Fig. 4
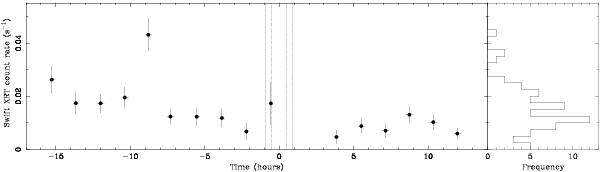
Swift/XRT X-ray light curve of HD 189733 about the time of the September 7, 2011 transit. The data were binned into one point per snapshot visit, with typical exposure times of about 27 min. Vertical dashed lines show the beginning and end of ingress and egress of the transit. A bright flare occurred about 8 h before the transit. The observed average count rate during the flare snapshot is a factor 3.6 higher than the mean for the whole light curve, indicating a peak X-ray flux (0.3−3 keV) that must be less than 1.3 × 10⁻¹² erg s-1 cm-2. For comparison, the right panel shows the distribution for 63 epochs of Swift measurements (including the 16 obtained in September 2011), covering a wide range of timescales. The flare occurring shortly before the transit is the highest X-ray flux of all 63 measurements.
Current usage metrics show cumulative count of Article Views (full-text article views including HTML views, PDF and ePub downloads, according to the available data) and Abstracts Views on Vision4Press platform.
Data correspond to usage on the plateform after 2015. The current usage metrics is available 48-96 hours after online publication and is updated daily on week days.
Initial download of the metrics may take a while.