| Issue |
A&A
Volume 543, July 2012
|
|
|---|---|---|
| Article Number | A75 | |
| Number of page(s) | 10 | |
| Section | Galactic structure, stellar clusters and populations | |
| DOI | https://doi.org/10.1051/0004-6361/201218847 | |
| Published online | 29 June 2012 | |
Integrated J- and H-band spectra of globular clusters in the LMC: implications for stellar population models and galaxy age dating⋆,⋆⋆,⋆⋆⋆
1 Max Planck Institute for Astronomy, Königstuhl 17, 69117 Heidelberg, Germany
e-mail: This email address is being protected from spambots. You need JavaScript enabled to view it.
2 European Southern Observatory, Karl-Schwarzschild-Str. 2, 85748 Garching bei München, Germany
3 National Optical Astronomy Observatory, 950 North Cherry Ave., Tucson, AZ, 85719 USA
Received: 19 January 2012
Accepted: 1 May 2012
Abstract
Context. The rest-frame near-IR spectra of intermediate age (1–2 Gyr) stellar populations are dominated by carbon based absorption features offering a wealth of information. Yet, spectral libraries that include the near-IR wavelength range do not sample a sufficiently broad range of ages and metallicities to allow for accurate calibration of stellar population models and thus the interpretation of the observations.
Aims. In this paper we investigate the integrated J- and H-band spectra of six intermediate age and old globular clusters in the Large Magellanic Cloud (LMC).
Methods. The observations for six clusters were obtained with the SINFONI integral field spectrograph at the ESO VLT Yepun telescope, covering the J (1.09–1.41 μm) and H-band (1.43–1.86 μm) spectral range. The spectral resolution is 6.7 Å in J and 6.6 Å in H-band (FWHM). The observations were made in natural seeing, covering the central 24″ × 24″ of each cluster and in addition sampling the brightest eight red giant branch and asymptotic giant branch (AGB) star candidates within the clusters’ tidal radii. Targeted clusters cover the ages of ~1.3 Gyr (NGC 1806, NGC 2162), 2 Gyr (NGC 2173) and ~13 Gyr (NGC 1754, NGC 2005, NGC 2019).
Results.H-band C2 and K-band 12CO (2–0) feature strengths for the LMC globular clusters are compared to the models of Maraston (2005). C2 is reasonably well reproduced by the models at all ages, while 12CO (2–0) shows good agreement for older (age ≥ 2 Gyr) populations, but the younger (1.3 Gyr) globular clusters do not follow the models. We argue that this is due to the fact that the empirical calibration of the models relies on only a few Milky Way carbon star spectra, which show different 12CO (2–0) index strengths than the LMC stars. The C2 absorption feature strength correlates strongly with age. It is present essentially only in populations that have 1–2 Gyr old stars, while its value is consistent with zero for older populations. The distinct spectral energy distribution observed for the intermediate age globular clusters in the J- and H-bands agrees well with the model predictions of Maraston for the contribution from the thermally pulsing AGB phase.
Conclusions. In this pilot project we present an empirical library of six LMC globular cluster integrated near-IR spectra that are useful for testing stellar population models in this wavelength regime. We show that the H-band C2 absorption feature and the J-, H-band spectral shape can be used as an age indicator for intermediate age stellar populations in integrated spectra of star clusters and galaxies.
Key words: Magellanic Clouds / galaxies: star clusters: general / stars: carbon
Based on observation collected at the ESO Paranal La Silla Observatory, Chile, Prog. ID 078.B-0205.
Table 2 is available in electronic form at http://www.aanda.org
J- and H-spectra are only available at the CDS via anonymous ftp to cdsarc.u-strasbg.fr (130.79.128.5) or via http://cdsarc.u-strasbg.fr/viz-bin/qcat?J/A+A/543/A75
© ESO, 2012
1. Introduction
With the appearance of more and better near-IR instruments, the studies of the stellar populations in galaxies in different environments and at various redshifts, exploring the rest-frame wavelength region between 1 and 2.5 μm, have become more frequent (e.g. Silva et al. 2008; Lançon et al. 2008; Hyvönen et al. 2009; Mármol-Queraltó et al. 2009; Cesetti et al. 2009; Martins et al. 2010; Riffel et al. 2011a). Thus a reliable framework to interpret these observations is needed. The comparison of observations with stellar population models is an approach that proved to be successful in the optical wavelength regime over the last decades. However, the near-IR range of the evolutionary populations synthesis (EPS) models still lacks a proper empirical calibration. Recent advances in theoretical as well as empirical calibration include in particular work on asymptotic giant branch (AGB) evolutionary phase, whose contribution is crucial to the near-IR part of the models (e.g. Marigo et al. 2008; Girardi et al. 2010; Maraston 1998, 2005). In Lyubenova et al. (2010, hereafter Paper I) we described our efforts to create a near-IR library of integrated spectra of globular clusters to serve as a calibrator and test bench for existing and future EPS models (e.g. Bruzual & Charlot 2003; Maraston 2005; Conroy et al. 2009; Maraston & Strömbäck 2011). For this pilot project we chose six globular clusters in the LMC, for which detailed information about the age and chemical composition exists, based on their resolved light. Our sample consists of three old (>10 Gyr) and metal poor ([Fe/H] ≃ −1.4) clusters, namely NGC 1754, NGC 2005, and NGC 2019, as well as three intermediate age (1–2 Gyr) and more metal rich ([Fe/H] ≃ −0.4) clusters: NGC 1806, NGC 2162, and NGC 2173 (see Table 1).
Target globular clusters in the LMC.
In Paper I, using the integrated K-band spectra of the globular clusters, we demonstrated the feasibility of our observational approach, as well as discussed some discrepancies that arise between recent EPS models and the data. We argued that the main reason for these discrepancies is the incompleteness of the current stellar spectral libraries of AGB stars that are used to create the models. Also, we illustrated how the presence of luminous carbon-rich AGB stars significantly changes the observed spectrophotometric properties in the K-band, especially the 12CO (2–0) 2.29 μm feature as predicted by Maraston (2005), despite the observational discrepancies.
This paper complements Paper I by presenting results based on the integrated J- and H-band spectra of the same globular clusters. To date there are very few studies of the spectral properties of globular clusters in this wavelength regime (e.g. Riffel et al. 2011b). The paper is organised as follows: in Sect. 2 we briefly recall our observing strategy and data reduction methods. In Sect. 3 we compare the observed overall spectral energy distributions of the globular clusters to stellar population models. Section 4 is devoted to the C2 absorption feature in the H-band and its behaviour in the spectra of globular clusters. In Sect. 5 we discuss potential reasons for the disagreement between model predictions and our observations, based on stellar libraries. Finally, in Sect. 6 we present our concluding remarks.
2. Observations and data reduction
2.1. Observations
Our sample of globular clusters, whose basic properties are listed in Table 1, were observed with VLT/SINFONI (Eisenhauer et al. 2003; Bonnet et al. 2004) in poor seeing conditions without adaptive optics in the period October–December 2006 (Prog. ID 078.B-0205, PI: Kuntschner). The detailed descriptions of the observing strategy, target selection and data reduction are given in Paper I, where we presented the K-band spectra from our project. In the present paper we explore the data obtained in the J- and H-bands, where minor differences in the data reduction exist. Briefly, in order to sample at least the half-light radius of the clusters, we observed a 3 × 3 mosaic of the largest field-of-view that SINFONI offers (8″ × 8″). Thus, the resulting coverage was 24″ × 24″, with a spatial sampling of 0 125 per pixel. For the observations we used the standard near-IR nodding technique. We observed each mosaic tile three times with individual integration times of 50 s and dithering of 025 to ensure better bad pixel rejection. We took sky exposures between each mosaic tile. Finally, within each cluster’s tidal radius, we selected up to eight bright stars with colours and magnitudes typical for the red giant branch (RGB) and AGB stars in the LMC (see Table 3 in Paper I), which were observed in addition to the cluster mosaics in order to better sample the short lived AGB phase. The integration times for these stars were 10 s. After each science target and at a similar airmass, we observed an A-B dwarf star for telluric absorption correction (Table 4 in Paper I).
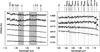 |
Fig. 1 Left panel: J-band, integrated spectra of the six LMC globular clusters. The shaded areas indicate the regions with contamination by strong OH and O2 sky line residuals. Right panel: H-band, integrated spectra of four of the LMC clusters. Due to unstable atmospheric conditions, the H-band spectra of NGC 1754 and NGC 2005 are heavily contaminated by sky line residuals and thus exibit a very low S/N and are not shown. Each spectrum is normalised to its median value. Line identifications are based on the stellar spectral atlases by Lançon & Rocca-Volmerange (1992), Wallace et al. (2000) and Rayner et al. (2009). |
2.2. Data reduction
We used the SINFONI pipeline version 2.0.5 to perform the basic data reduction on the three exposures per mosaic tile plus two bracketing sky exposures. In brief, the pipeline extracts the raw data, applies distortion, bad pixel and flat-field corrections, wavelength calibration, and stores the combined sky-subtracted spectra in a 3-dimensional data cube. Then on each resulting data cube we ran the lac3d code (Davies et al. 2010), whose purpose is to detect and correct residual bad pixels that are identified using a 3D Laplacian edge detection method. This code not only removes residual bad pixels, but also produces an error data cube for each input science data cube, which is very useful, because the SINFONI pipeline does not provide an estimate of the error propagation during data reduction. The derived signal-to-noise ratio, using these error spectra, is in agreement with the signal-to-noise ratio (S/N) derived using an empirical method described by Stoehr et al. (2007).
In the J-band we had to switch off the pipeline option to correct for sky line residuals based on the algorithm described in Davies (2007, i.e. –objnod-sky_cor = FALSE. This was needed due to the complicated pattern of overlapping OH and O2 sky emission lines in this wavelength region (see e.g. Rousselot et al. 2000), which leads to their over- or under-subtraction when applying the sky residual correction. Therefore, we applied simple sky subtraction and indicated the regions where the sky lines are the strongest in Fig. 1 (i.e. 1.21–1.236 μm and 1.26–1.295 μm).
We reduced the telluric star data in the same way as the science frames. Then for each telluric star we extracted a one-dimensional spectrum, removed the hydrogen absorption lines fitted with a Lorentzian profile, and divided the star spectrum by a black body spectrum with the same temperature as the star. The last step in preparing the telluric correction spectrum was to apply small shifts (<0.05 pixels) and scalings to minimise the residuals of the telluric features. Finally, we divided each science data cube by the corresponding telluric spectrum. In this way we also obtained an approximate relative flux calibration. An absolute flux calibration was not possible due to non-photometric conditions.
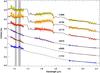 |
Fig. 2 J, H, K-band spectral energy distributions of our sample of six LMC globular clusters. The black solid lines indicate the most closely matching (in age and metallicity) stellar population model of Maraston (2005); i.e. age = 13 Gyr, [Z/H] = −1.35 for NGC 1754, NGC 2005, and NGC 2019, age = 2 Gyr, [Z/H] = −0.33 for NGC 2173, and age = 1.5 Gyr, [Z/H] = −0.33 for NGC 1806 and NGC 2162. The spectra are normalised to the flux at 1.25 μm. Note the prominent spectral shape differences in the J- and H-bands between old and intermediate age clusters. The shaded areas indicate the regions with contamination by strong OH and O2 sky line residuals. |
The telluric star HD 44533, used for the telluric correction of the observations for NGC 2019 and its surrounding stars, had an unusual shape of the hydrogen lines. It seems that this star shows some hydrogen emission together with absorption. Thus, to remove the hydrogen lines, we interpolated linearly over the affected regions, which are not overlapping with any indices used in this study. However, we add a word of caution to treat these regions with care in case the spectra of NGC 2019 are used in the future for other purposes.
2.3. Spectra integration
To obtain the final, integrated J- and H-band spectra for the six globular clusters, we estimated the noise level in each reconstructed image from the central mosaic data cubes. We assumed that this noise is due to residuals after the sky background correction. Thus, we computed the median residual sky noise level and its standard deviation, after clipping all data points with intensities of more than 3σ. We then selected all spaxels, which have an intensity more than three times the standard deviation above the median residual sky noise level. We summed them and normalised the resulting spectrum to 1 s of exposure time. The same approach was used to obtain the spectra for the additional bright RGB and AGB stars.
The final step in preparing the luminosity weighted, integrated spectra for the six globular clusters was to add the additionally observed bright stars outside the central mosaics (for a detailed discussion on cluster membership and which stars where included, see Sect. 4 in Paper I and Table 2). Figure 1 shows the final, integrated J- and H-band spectra for the six LMC globular clusters. The spectra of the three intermediate age clusters are shown on the top (NGC 1806, NGC 2162, and NGC 2173). These spectra display numerous absorption features due to carbon based molecules, like CO, C2, and CN which makes them appear to be very noisy, while in fact they are not. The spectra of the old and metal poor clusters (NGC 2019, NGC 2005, and NGC 1754) are shown at the bottom. These are dominated by late-type giant stars, where the metallic lines are more prominent. To identify the spectral absorption lines displayed in Fig. 1, we used the stellar spectral atlases of Lançon & Rocca-Volmerange (1992), Wallace et al. (2000), and Rayner et al. (2009). The weather conditions during the observations of the H-band spectra for NGC 1754 and NGC 2005 were not favourable, which resulted in a S/N that was too low and contamination by multiple sky line residuals. Thus we decided to exclude these two spectra from our analysis.
The spectral resolution of our spectra, as measured from arc lamp frames, is 6.7 Å and 6.6 Å (FWHM) in the J and H-band, respectively. Finally, we estimated the S/N of each integrated globular cluster spectrum using the method of Stoehr et al. (2007) and listed the values in Table 1. This method allows us to compute the S/N from the spectrum itself. However, due to the numerous absorption features mimicking noise in the spectra of globular clusters containing carbon-rich AGB stars, i.e. the three intermediate age clusters marked with an asterisks in Table 1, we are able to give only a lower threshold. Based on the integration times and luminosities of the clusters, we conclude that the quality of these intermediate age spectra is as good, if not better, than those of the old globular clusters.
3. The overall near-IR spectral energy distribution
Having completed the primary goal of our project, namely to provide an empirical library of integrated near-IR spectra of globular clusters, we show in Fig. 2 the overall J, H and K-band spectra as derived from our SINFONI observations, compared to the spectral energy distributions from the Maraston (2005) stellar population models. The observed spectral segments were scaled individually relative to the model providing the closest match in age and metallicity and were normalised to unity at 1.25 μm (see figure caption). In the figure the models are represented with solid, black lines. With the exception of the J-band part in old globular clusters, where we were unable to achieve good sky background removal, as explained in Sect. 2.2, the models agree well with the general spectral shape of our spectra. Remarkably, the distinct spectral energy distribution (the “sawtooth” pattern) in the J- and H-bands caused by the contribution from carbon-rich thermally pulsing AGB (TP-AGB) phase is visible in the spectral regions covered by SINFONI for the intermediate age clusters. As expected the pattern is less prominent for the cluster NGC 2173 due to its slightly older age. Also, the most prominent features such as C2 at 1.77 μm and the CO bandhead at 2.29 μm are well matched. Thus, when they become available, it will be very interesting to make a comparison with higher spectral resolution EPS models. Weaker features, as the ones indicated in Fig. 1, could be studied in detail. In this figure, in addition to carbon based molecular absorption bands, several other absorption features are indicated. They are mainly due to metallic lines, such as Fe I, Mg I, Si I, and Al I. However, due to their relative weakness and associated difficulty of measuring them in galaxies, we decided not to discuss them further in this paper.
4. The H-band C2 index
One of the most prominent and easy to quantify features in the H-band is the C2 (0–0) bandhead at 1.77 μm (Ballik & Ramsay 1963). The existence of the C2 molecule is typical for carbon-rich stars, where the ratio of carbon to oxygen (C/O) atoms is larger than 1. This type of star is the main contributor to the near-IR light of intermediate age (1–3 Gyr) stellar populations (e.g. Ferraro et al. 1995; Girardi & Bertelli 1998; Maraston 1998, 2005). Thus, it is expected that the C2 absorption feature will be strong in globular clusters and galaxies with stellar populations in this age interval (Lançon et al. 1999; Maraston 2005). Also, more metal poor stellar populations exhibit a stronger C2 index on average, because dredge-up more easily leads to C/O > 1 in that regime (Wagenhuber & Groenewegen 1998; Mouhcine & Lançon 2003; Weiss & Ferguson 2009).
The C2 index reflects the depth of the C2 absorption feature at 1.77 μm (Alvarez et al. 2000). In our work we used the definition employed by Maraston (2005, hereafter we refer to this definition as “classical”). The index is defined in magnitudes, as the flux ratio between a central passband (1.768–1.782 μm) and a continuum passband (1.752–1.762 μm), and is normalised to Vega by subtracting a zero point of 0.038m. In this definition of the index, the continuum band is on top of H2O and 12CO features (see Fig. 3, top panel). While carbon-rich stars are not expected to have H2O absorption, these two features may vary with the pulsation period for oxygen-rich stars (Loidl et al. 2001).
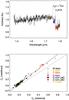 |
Fig. 3 Top panel: spectrum of NGC 1806 with overplotted central passband (red) and the classical continuum region (blue) for the C2 index (Maraston 2005). In orange we overplot the new continuum region for the C2 index defined in this paper (see Sect. 4). Bottom panel: comparison between the classical and the redefined C2 index, measured on our own LMC star observations (solid black and red symbols), as well as the stars from the Milky Way spectral libraries of Lançon & Mouhcine (2002, orange) and Rayner et al. (2009, black diamonds, green squares, red asterisks). The dashed line shows the one-to-one relation, the solid line represents a linear least squares fit to all data points. |
Because of these additional contributions to the continuum passband we explored a modified index definition by shifting the continuum passband to shorter wavelengths relative to the classical definition (1.74–1.75 μm, shown in orange in Fig. 3). The Vega zero point to be subtracted is 0.037m. We measured the two indices for the LMC stars from our own observations, the carbon-rich averaged stellar spectra of Lançon & Mouhcine (2002) and the stars from the library of Rayner et al. (2009). The comparison is shown in Fig. 3 (bottom panel). We found that for these samples the scatter is not significant, but one might expect it in a larger sample, and in particular if one includes AGB stars in different pulsation phases. For the present study we decided to use the classical index definition for direct comparison to models. The measurements for the stars in our library are listed in Table 2 and for the globular clusters in Table 3.
Measurements of DCO and C2 indices for the LMC globular clusters.
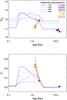 |
Fig. 4 Comparison between C2 index values and the models of Maraston (2005). The ages of the clusters are the mean ones from Table 1 with error bars reflecting the rms. For guidance, in the top panel we reproduce the K-band DCO index from Paper I (their Fig. 9). In both panels with black arrows we indicated how the spectrum of NGC 2173 changes when adding different fractions of LMC carbon star light to it. The red arrows indicate the changes in the same spectrum, but adding different fractions of the averaged Milky Way carbon star spectrum of Lançon & Mouhcine (2002). See text for a detailed description. |
Figure 4 shows a comparison between our measurements of the C2 index for the LMC globular clusters and the SSP model predictions of Maraston (2005). In the top panel, for guidance, we repeat Fig. 9 from Paper I, showing the K-band DCO index. This index is sensitive to the metallicity at older ages, but also shows a dependence on the presence of carbon-rich stars at intermediate ages. We measured the DCO and C2 indices at the nominal spectral resolution of the data. Current models have lower spectral resolution than our data. However, due to the broadness and intrinsic strength of these spectral features, the differences in spectral resolution will not affect our conclusions. We tested this by broadening our globular cluster spectra to spectral resolutions ranging from 50 to 400 kms-1 in steps of 50 kms-1. The largest offset we measured was −0.03 for both the DCO and C2 indices, which is much smaller than the observed differences between observations and models.
For old stellar populations (>3 Gyr) the models predict an approximately constant and zero value of the C2 index (Fig. 4, bottom panel). The C2 index measurement for the old globular cluster NGC 2019 in this age range whose metallicity is best compared to the model with [Z/H] = −1.35 (solid, blue line), is consistent with the model predictions. We note that we were unable to measure the C2 index in the other two old and metal poor clusters in our sample, due to the very low quality of their H-band spectra.
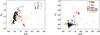 |
Fig. 5 DCO(left) and C2(right panel) indices versus (J − K) colour for stars in the Milky Way and the LMC. The oxygen- and carbon-rich LMC stars (filled black and red dots, respectively) are from our own SINFONI observations, the K (green open squares), M (black diamonds), C (red asterisks), and S (red asterisks with square around) stars are taken from the SpeX library of Rayner et al. (2009). The C-rich spectra in the Milky Way (orange crosses) are taken from the library of Lançon & Mouhcine (2002). Typical error bars are shown in the upper right corner of the left panel. In the left panel, the solid line denotes the relation for LMC carbon-rich stars from Lyubenova et al. (2010, Eq. (3)), the dashed line (Eq. (5) in the same paper) represents the relation for the Milky Way spectra of Lançon & Mouhcine (2002). |
The group of the three intermediate age and more metal rich clusters is best compared with the SSP model with [Z/H] = −0.33 (blue, dotted line). The C2 index measurement for NGC 2173 (2 Gyr, red solid symbol) is consistent with the model prediction of increasing C2 index towards younger ages. The youngest globular clusters at ~1.3 Gyr (NGC 1806 and NGC 2162) follow this trend, although their C2 index is significantly larger than the model prediction. The latter observation supports our findings based on the K-band DCO index in Paper I. There, we argued that the reason for the discrepancy between the CO index predictions of the models and the data (see Fig. 4, top panel) is due to the presence of carbon-rich stars which influence the spectrophotometric properties of stellar populations at intermediate ages. The empirical calibration of the models is based on spectra of the Milky Way carbon stars from the library of Lançon & Mouhcine (2002), combined with photometric calibration based on the LMC globular clusters, which led to inconsistent results. The presence of LMC carbon-rich stars in the spectra leads to a decrease of the DCO index, but to an increase of the C2 index. To test this claim, we used the spectrum of NGC 2173, which is the “oldest” intermediate-age globular cluster and therefore the one with the least contribution from carbon-rich stars in our sample (Mucciarelli et al. 2006), as a baseline for a simplistic stellar population modelling test. Increasing the contribution from TP-AGB stars in this cluster would mimic a younger age, such as seen in NGC 1806 and NGC 2162. In this way we are able to test the effects of different carbon- to oxygen-rich stars ratios in a given stellar population on its spectral features. When we added 40% to 70% of the averaged Milky Way stellar spectrum contained in the 3rd bin of Lançon & Mouhcine (2002) to the spectrum of NGC 2173, the resulting C2 and DCO indices increased, as predicted by the models for the younger clusters (red arrows in Fig. 4). When performing the same test, but adding the spectrum of a carbon star in the LMC (in this case the star 2MASS J06002748-6342222 in NGC 2162) to the cluster, the resultant DCO index decreased (black arrows in the same figure) and fitted the observations of the younger clusters better. Contrary to the DCO index dependence on C-star content, the resultant C2 index increased consistent with the model predictions regardless if the C-star is taken from the Milky Way or the LMC.
The results from the above tests depend on the actual carbon star spectrum that is used to perform the test. Carbon stars exhibit large variations in their properties for a given environment, as we discuss further in Sect. 5 (see also e.g. Lançon & Mouhcine 2002). This caveat illustrates the intrinsic problem of stochastic fluctuations of AGB stars in globular clusters (see e.g. review by Lançon 2011). AGB stars are rare in stellar populations, with only one in a population of 104 stars in total. Nevertheless, a single star can produce up to 80% of the stellar population’s near-IR light (Maraston 2005). Here we see that it can also play a very important role in the integrated spectral properties of the hosting stellar population. This will inevitably lead to large or even significant deviations between the model predictions and observations of individual clusters. Various authors have made extensive studies of the influence of such stochastic fluctuations for the integrated colours of stellar clusters (e.g. Piskunov et al. 2009; Popescu & Hanson 2010; Fouesneau & Lançon 2010). A similar study for the spectral features in integrated spectra of globular clusters would be beneficial for the interpretation and judgment of our results.
5. Carbon-rich AGB stars in the LMC and the Milky Way
A possible explanation for the differences between models and observations, described in the previous section, may be the different metallicities or carbon and oxygen abundances of the sample stars. In more metal poor stars (i.e. the LMC stars), the C/O ratio is higher on average. Matsuura et al. (2002) argue for a systematically larger C/O ratio in LMC carbon stars compared to Galactic ones. Models of carbon-rich stars with higher C/O ratio have weaker CO features, but stronger C2 features (Loidl et al. 2001; Aringer et al. 2009). We note that a variation in the molecular bands of carbon stars during their pulsation cycles is not expected to be strong (Loidl et al. 2001). In Paper I we supported this scenario, i.e. the difference in metallicity to be the cause of the discrepancy, by showing that stars in the LMC and the Milky Way with similar (J − K) colours can have substantially different DCO index values, as Cohen et al. (1981) and Frogel et al. (1990) have shown earlier as well.
Based on the limited stellar samples discussed there, we speculate that the LMC carbon-rich stars have weaker DCO indices when compared to carbon stars in the Milky Way. In Fig. 5 (left panel) we repeat the diagram and add stars from the SpeX library (Rayner et al. 2009). This library contains spectra of mostly near-solar metallicity K and M stars with luminosity classes between I and V, carbon-rich stars and S-stars (for which C/O ≃ 1). For half of the carbon-rich stars (four) we could find iron abundance estimates in the PASTEL database (Soubiran et al. 2010), ranging from −0.3 to 0.2 dex. Their mean iron abundance is slightly sub-solar, which is on average more metal-rich than the sample of LMC carbon stars with [Fe/H] ≃ −0.4. The carbon-rich stars from the SpeX sample are located between the two relations, found in Paper I, for LMC (solid line) and Milky Way (dashed line) carbon stars from the library of Lançon & Mouhcine (2002), thus smearing any clear relations. Moreover, if instead of the averaged Milky Way carbon star spectra, the individual stars of Lançon & Wood (2000) were plotted, then the dispersion would have been even more prominent. However, we do not observe DCO in any of the Milky Way stars as weak as in three of the LMC stars. Surprisingly, on the (J − K) – C2 plot (Fig. 5, right panel) there is no obvious difference between the stars in the two galaxies. Assuming the lower metallicity of the LMC and the higher C/O ratio, as argued by Matsuura et al. (2002), the C2 index is expected to be stronger in the LMC than in the Milky Way carbon stars. Instead we find the opposite: that two of the Galactic stars have a stronger C2 index than the LMC stars. This could be due to the C/O ratio changing at every dredge-up episode, thus leading to a dispersion in the C2 index larger than the metallicity effect. Based on the three stellar samples explored here, we cannot confirm that there is a marked difference between the Milky Way and LMC carbon stars in terms of the C/O ratio. To reach conclusive results about the dependence of the C2 index on the C/O ratio, different element abundances, and the metallicity of the stars, detailed abundance measurements for a larger sample of LMC and Milky Way giant stars are necessary.
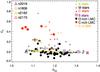 |
Fig. 6 DCO vs. C2 index for stellar and globular cluster spectra. Origin of spectra, symbols and colours as in Fig. 5. Error bars are about the size or smaller than the symbols, thus they are not explicitly shown. Coloured triangles show the measurements for the integrated spectra of LMC globular clusters. |
Figure 6 shows the behaviour of the K-band CO versus the H-band C2 features in stellar spectra. The complete sample of stars displays a large spread of DCO index values, while the C2 index is significantly stronger than zero only in carbon-rich stars. There are also a number of M-type stars (M6-9III), whose C2 index is larger than zero but is still systematically smaller than the value of C2 in C-type stars. In these stars there is significant H2O absorption in the range 1.7–2.05 μm (e.g. Matsuura et al. 1999; Rayner et al. 2009) that leads to a steep decrease of the continuum at the location where the C2 feature is located. Thus, when measuring the C2 index in these M giants we obtained a non-zero index value, while in reality there is no C2 absorption.
Based on this figure, there is no clear separation between LMC and Milky Way carbon-stars, although the LMC stars have on average lower DCO indices, which is consistent with their lower metallicity. However, the same LMC stars do not show a stronger C2 index, which would be expected as discussed earlier in the text.
There is one C-type star from the catalogue of Rayner et al. (2009) that shows DCO and C2 indices and a (J − K) colour consistent with K and M-type stars (see Fig. 5). This is HD 76846, classified as C-R2 (Keenan & Newsom 2000). As Tanaka et al. (2007) have shown, the C2 feature is intrinsically weak in early hotter C-R stars.
In Fig. 6, for comparison, we show the measured DCO and C2 indices from the integrated LMC globular cluster spectra (coloured triangles). The two clusters that are dominated by carbon stars, NGC 1806 and NGC 2162, follow the stellar trends of higher C2 index values. Such a near-IR spectroscopic index diagnostic plot can be very helpful in revealing the age of a given integrated stellar population, being a stellar cluster or a galaxy. As shown above, the C2 feature is present and its strength is significant only in carbon stars and stellar populations harbouring such. Lançon et al. (1999) have already proposed a similar C2 index, that can be used to detect the presence of intermediate age stellar populations. Even when smeared out by the line-of-sight velocity distribution of stars in galaxies of the order of 400 kms-1, it will remain identifiable and measurable. By observing an increased strength of the C2 index, one can conclude that the object is in the carbon-star phase and thus date it to an intermediate age of 1–2 Gyr.
6. Concluding remarks
In this paper we concluded our pilot project of providing an empirical near-IR library of integrated spectra of globular clusters in the LMC by adding J- and H-band spectra to the K-band ones from Lyubenova et al. (2010, Paper I). We provided full near-IR spectral coverage (as observable from the ground) for four globular clusters: the old and metal poor cluster NGC 2019, and the intermediate age and approximately half-solar metallicity clusters NGC 1806, NGC 2162, and NGC 2173. For the old and metal poor clusters NGC 1754 and NGC 2005 the H-band part is missing due to bad observing conditions and unacceptable sky emission subtraction residuals. Using our sample of globular clusters we tested predictions of current evolutionary population synthesis models in the near-IR and discussed some of the problems that arise from this comparison. Although still influenced by small number statistics, our spectra show that the near-IR spectral domain is a useful source of information when applied to the study of integrated stellar populations.
One of the main goals of our project was to provide a small empirical library of near-IR spectra of globular clusters to serve as a test bench for current and future stellar population models. In Fig. 2 we presented a comparison between the overall near-IR spectral energy distribution of sample clusters and the stellar population models of Maraston (2005). The models agree remarkably well with the data in terms of the spectral shape and the most prominent absorption features. Especially, the predicted distinct signatures of the TP-AGB phase in intermediate age (1–2 Gyr) stellar populations are nicely reproduced.
However, the agreement is not so good when exploring individual spectral features in more detail, where more subtle differences in absorption strength can be quantified. Here, as well as in Paper I, we concentrated our studies to the strongest absorption features in the near-IR, namely C2 at 1.77 μm and 12CO (2–0) at 2.29 μm, due to the limited spectral resolution of the current models. We described their behaviour using two indices: C2 and DCO, respectively. The first one reflects the presence of carbon-rich AGB stars in the stellar population, while the second is typical for both carbon- and oxygen- rich AGB and RGB stars. We refer the reader to Sect. 4, where we discussed in detail the observed differences between our observations and the EPS models of Maraston (2005). In Sect. 5 we explored some possible reasons for these, based on stellar libraries with Milky Way and LMC carbon-rich stars (see Fig. 5). These stars can contribute up to 80% to the total K-band light of a globular cluster stellar population, thus their proper inclusion in models is crucial. Our results were inconclusive about the proposed difference in the C/O ratio between stars in the Galaxy and the LMC. To confirm or reject this, accurate abundance measurements of iron, oxygen and carbon elements are necessary. Therefore, there is a clear need for larger spectral libraries of carbon-rich stars with a range of metallicities before we are able to reproduce their proper contribution to the stellar population models.
The occurrence of a strong C2 index in the near-IR spectra of globular clusters and hence in galaxies is an indication that they are in the carbon star phase, which dates the hosting stellar population to 1–2 Gyr, as previously suggested by Lançon et al. (1999). In contrast, the DCO index is much less straightforward to interpret, since the magnitude of this index is driven by a complex combination of metallicity, surface gravity (luminosity), and effective temperature, as illustrated by Fig. 5. In Fig. 6 we propose a diagnostic plot, based only on these two near-IR indices. Both of them are sufficiently broad and strong, so they can be easily measured in galaxy spectra, even when smeared out by the line-of-sight velocity distribution of the stars. For galaxies up to a redshift of 0.007, e.g. Virgo and Fornax clusters, the C2 feature is in the rest-frame H-band. For redshifts between 0.007 and 0.13 the feature is hidden by the atmospheric cutoff, but it remains accessible from space.
During the next decades new facilities, such as the JWST and the E-ELT, will widen the discovery space in extragalactic research. Their enhanced sensitivity will be in the infrared portion of the spectrum. However, the stellar population analysis methods for the integrated light are not yet fully developed in the near-IR wavelength regime. The methods discussed here offer a step towards a better understanding of galaxy evolution and observations are already feasible with current facilities. For example, current adaptive optics systems, working mostly in the near-IR, offer a possibility to resolve the innermost parts of nearby galaxies. New information about the stellar population properties at these spatial scales can give us important clues about how galaxies have formed and evolved.
Online material
Near-IR colours and spectral indices of the additional bright RGB and AGB stars.
Acknowledgments
We are grateful to the many ESO astronomers who obtained the data presented in this paper in service mode operations at La Silla Paranal Observatory. We thank Livia Origlia for useful discussions on near-IR spectral synthesis and Claudia Maraston for her comments. M.L. would like to thank ESO’s Visitors Program as well as the staff at the Astronomical Observatory of the University of Sofia for their hospitality, where major parts of this research have been carried out. Finally, we thank the referee for helpful suggestions, which certainly made this paper more complete. This paper is dedicated to Ralitsa Mitkova, a tiny star that evolved together with this manuscript and ever since provides an endless source of inspiration.
References
- Alvarez, R., Lançon, A., Plez, B., & Wood, P. R. 2000, A&A, 353, 322 [NASA ADS] [Google Scholar]
- Aringer, B., Girardi, L., Nowotny, W., Marigo, P., & Lederer, M. T. 2009, A&A, 503, 913 [NASA ADS] [CrossRef] [EDP Sciences] [Google Scholar]
- Ballik, E. A., & Ramsay, D. A. 1963, ApJ, 137, 61 [NASA ADS] [CrossRef] [Google Scholar]
- Beasley, M. A., Hoyle, F., & Sharples, R. M. 2002, MNRAS, 336, 168 [NASA ADS] [CrossRef] [Google Scholar]
- Bertelli, G., Nasi, E., Girardi, L., et al. 2003, AJ, 125, 770 [NASA ADS] [CrossRef] [Google Scholar]
- Bonnet, H., Abuter, R., Baker, A., et al. 2004, in The ESO Messenger, 117 [Google Scholar]
- Bruzual, G., & Charlot, S. 2003, MNRAS, 344, 1000 [NASA ADS] [CrossRef] [Google Scholar]
- Cesetti, M., Ivanov, V. D., Morelli, L., et al. 2009, A&A, 497, 41 [NASA ADS] [CrossRef] [EDP Sciences] [Google Scholar]
- Cohen, J. G., Persson, S. E., Elias, J. H., & Frogel, J. A. 1981, ApJ, 249, 481 [NASA ADS] [CrossRef] [Google Scholar]
- Conroy, C., Gunn, J. E., & White, M. 2009, ApJ, 699, 486 [NASA ADS] [CrossRef] [Google Scholar]
- Davies, R. I. 2007, MNRAS, 375, 1099 [NASA ADS] [CrossRef] [Google Scholar]
- Davies, R., Agudo Berbel, A., Wiezorrek, E., Ott, T., & Förster Schreiber, N. M. 2010, in Proc. SPIE 7735, eds. I. McClean, S. Ramsay, & H. Takami, 77356 [Google Scholar]
- Dirsch, B., Richtler, T., Gieren, W. P., & Hilker, M. 2000, A&A, 360, 133 [NASA ADS] [Google Scholar]
- Eisenhauer, F., Abuter, R., Bickert, K., et al. 2003, in Proc. SPIE 4841, eds. M. Iye, & A. F. M. Moorwood, 1548 [Google Scholar]
- Ferraro, F. R., Fusi Pecci, F., Testa, V., et al. 1995, MNRAS, 272, 391 [NASA ADS] [CrossRef] [Google Scholar]
- Fouesneau, M., & Lançon, A. 2010, A&A, 521, A22 [NASA ADS] [CrossRef] [EDP Sciences] [Google Scholar]
- Frogel, J. A., Mould, J., & Blanco, V. M. 1990, ApJ, 352, 96 [NASA ADS] [CrossRef] [Google Scholar]
- Geisler, D., Bica, E., Dottori, H., et al. 1997, AJ, 114, 1920 [NASA ADS] [CrossRef] [Google Scholar]
- Girardi, L., & Bertelli, G. 1998, MNRAS, 300, 533 [NASA ADS] [CrossRef] [Google Scholar]
- Girardi, L., Chiosi, C., Bertelli, G., & Bressan, A. 1995, A&A, 298, 87 [NASA ADS] [Google Scholar]
- Girardi, L., Williams, B. F., Gilbert, K. M., et al. 2010, ApJ, 724, 1030 [NASA ADS] [CrossRef] [Google Scholar]
- Grocholski, A. J., Cole, A. A., Sarajedini, A., Geisler, D., & Smith, V. V. 2006, AJ, 132, 1630 [NASA ADS] [CrossRef] [Google Scholar]
- Hyvönen, T., Kotilainen, J. K., Reunanen, J., & Falomo, R. 2009, A&A, 499, 417 [NASA ADS] [CrossRef] [EDP Sciences] [Google Scholar]
- Johnson, J. A., Ivans, I. I., & Stetson, P. B. 2006, ApJ, 640, 801 [NASA ADS] [CrossRef] [Google Scholar]
- Keenan, P., & Newsom, G. 2000, revised Catalog of MK Classifications of the Cooler Stars [Google Scholar]
- Kerber, L. O., Santiago, B. X., & Brocato, E. 2007, A&A, 462, 139 [NASA ADS] [CrossRef] [EDP Sciences] [Google Scholar]
- Lançon, A. 2011, in Why Galaxies Care about AGB Stars II: Shining Examples and Common Inhabitants, eds. F. Kerschbaum, T. Lebzelter, & R. F. Wing, ASP Conf. Ser., 445, 379 [Google Scholar]
- Lançon, A., & Mouhcine, M. 2002, A&A, 393, 167 [NASA ADS] [CrossRef] [EDP Sciences] [Google Scholar]
- Lançon, A., & Rocca-Volmerange, B. 1992, A&AS, 96, 593 [NASA ADS] [Google Scholar]
- Lançon, A., & Wood, P. R. 2000, A&AS, 146, 217 [NASA ADS] [CrossRef] [EDP Sciences] [Google Scholar]
- Lançon, A., Mouhcine, M., Fioc, M., & Silva, D. 1999, A&A, 344, L21 [NASA ADS] [Google Scholar]
- Lançon, A., Gallagher, III, J. S., Mouhcine, M., et al. 2008, A&A, 486, 165 [NASA ADS] [CrossRef] [EDP Sciences] [Google Scholar]
- Leonardi, A. J., & Rose, J. A. 2003, AJ, 126, 1811 [NASA ADS] [CrossRef] [Google Scholar]
- Loidl, R., Lançon, A., & Jørgensen, U. G. 2001, A&A, 371, 1065 [NASA ADS] [CrossRef] [EDP Sciences] [Google Scholar]
- Lyubenova, M., Kuntschner, H., Rejkuba, M., et al. 2010, A&A, 510, A19 (Paper I) [NASA ADS] [CrossRef] [EDP Sciences] [Google Scholar]
- Mackey, A. D., Broby Nielsen, P., Ferguson, A. M. N., & Richardson, J. C. 2008, ApJ, 681, L17 [NASA ADS] [CrossRef] [Google Scholar]
- Maraston, C. 1998, MNRAS, 300, 872 [NASA ADS] [CrossRef] [Google Scholar]
- Maraston, C. 2005, MNRAS, 362, 799 [NASA ADS] [CrossRef] [Google Scholar]
- Maraston, C., & Strömbäck, G. 2011, MNRAS, 418, 2785 [NASA ADS] [CrossRef] [Google Scholar]
- Marigo, P., Girardi, L., Bressan, A., et al. 2008, A&A, 482, 883 [NASA ADS] [CrossRef] [EDP Sciences] [Google Scholar]
- Mármol-Queraltó, E., Cardiel, N., Cenarro, A. J., et al. 2008, A&A, 489, 885 [NASA ADS] [CrossRef] [EDP Sciences] [Google Scholar]
- Mármol-Queraltó, E., Cardiel, N., Sánchez-Blázquez, P., et al. 2009, ApJ, 705, L199 [CrossRef] [Google Scholar]
- Martins, L. P., Rodríguez-Ardila, A., de Souza, R., & Gruenwald, R. 2010, MNRAS, 406, 2168 [NASA ADS] [CrossRef] [Google Scholar]
- Matsuura, M., Yamamura, I., Murakami, H., Freund, M. M., & Tanaka, M. 1999, A&A, 348, 579 [NASA ADS] [Google Scholar]
- Matsuura, M., Zijlstra, A. A., van Loon, J. T., et al. 2002, ApJ, 580, L133 [NASA ADS] [CrossRef] [Google Scholar]
- McLaughlin, D. E., & van der Marel, R. P. 2005, ApJS, 161, 304 [NASA ADS] [CrossRef] [Google Scholar]
- Milone, A. P., Bedin, L. R., Piotto, G., & Anderson, J. 2009, A&A, 497, 755 [NASA ADS] [CrossRef] [EDP Sciences] [Google Scholar]
- Mouhcine, M., & Lançon, A. 2003, MNRAS, 338, 572 [NASA ADS] [CrossRef] [Google Scholar]
- Mucciarelli, A., Origlia, L., Ferraro, F. R., Maraston, C., & Testa, V. 2006, ApJ, 646, 939 [NASA ADS] [CrossRef] [Google Scholar]
- Mucciarelli, A., Carretta, E., Origlia, L., & Ferraro, F. R. 2008, AJ, 136, 375 [NASA ADS] [CrossRef] [Google Scholar]
- Olsen, K. A. G., Hodge, P. W., Mateo, M., et al. 1998, MNRAS, 300, 665 [NASA ADS] [CrossRef] [Google Scholar]
- Olszewski, E. W., Schommer, R. A., Suntzeff, N. B., & Harris, H. C. 1991, AJ, 101, 515 [NASA ADS] [CrossRef] [Google Scholar]
- Piskunov, A. E., Kharchenko, N. V., Schilbach, E., et al. 2009, A&A, 507, L5 [NASA ADS] [CrossRef] [EDP Sciences] [Google Scholar]
- Popescu, B., & Hanson, M. M. 2010, ApJ, 713, L21 [NASA ADS] [CrossRef] [Google Scholar]
- Rayner, J. T., Cushing, M. C., & Vacca, W. D. 2009, ApJS, 185, 289 [NASA ADS] [CrossRef] [Google Scholar]
- Riffel, R., Riffel, R. A., Ferrari, F., & Storchi-Bergmann, T. 2011a, MNRAS, 416, 493 [NASA ADS] [Google Scholar]
- Riffel, R., Ruschel-Dutra, D., Pastoriza, M. G., et al. 2011b, MNRAS, 410, 2714 [NASA ADS] [CrossRef] [Google Scholar]
- Rousselot, P., Lidman, C., Cuby, J.-G., Moreels, G., & Monnet, G. 2000, A&A, 354, 1134 [NASA ADS] [Google Scholar]
- Silva, D. R., Kuntschner, H., & Lyubenova, M. 2008, ApJ, 674, 194 [NASA ADS] [CrossRef] [Google Scholar]
- Skrutskie, M. F., Cutri, R. M., Stiening, R., et al. 2006, AJ, 131, 1163 [NASA ADS] [CrossRef] [Google Scholar]
- Soubiran, C., Le Campion, J.-F., Cayrel de Strobel, G., & Caillo, A. 2010, A&A, 515, A111 [NASA ADS] [CrossRef] [EDP Sciences] [Google Scholar]
- Stoehr, F., Fraquelli, D., Kamp, I., et al. 2007, Space Telescope European Coordinating Facility Newsletter, 42, 4 [NASA ADS] [Google Scholar]
- Tanaka, M., Letip, A., Nishimaki, Y., et al. 2007, PASJ, 59, 939 [NASA ADS] [Google Scholar]
- Wagenhuber, J., & Groenewegen, M. A. T. 1998, A&A, 340, 183 [NASA ADS] [Google Scholar]
- Wallace, L., Meyer, M. R., Hinkle, K., & Edwards, S. 2000, ApJ, 535, 325 [NASA ADS] [CrossRef] [MathSciNet] [Google Scholar]
- Weiss, A., & Ferguson, J. W. 2009, A&A, 508, 1343 [NASA ADS] [CrossRef] [EDP Sciences] [Google Scholar]
- Woo, J.-H., Gallart, C., Demarque, P., Yi, S., & Zoccali, M. 2003, AJ, 125, 754 [NASA ADS] [CrossRef] [Google Scholar]
All Tables
All Figures
|
Fig. 1 Left panel: J-band, integrated spectra of the six LMC globular clusters. The shaded areas indicate the regions with contamination by strong OH and O2 sky line residuals. Right panel: H-band, integrated spectra of four of the LMC clusters. Due to unstable atmospheric conditions, the H-band spectra of NGC 1754 and NGC 2005 are heavily contaminated by sky line residuals and thus exibit a very low S/N and are not shown. Each spectrum is normalised to its median value. Line identifications are based on the stellar spectral atlases by Lançon & Rocca-Volmerange (1992), Wallace et al. (2000) and Rayner et al. (2009). |
| In the text | |
|
Fig. 2 J, H, K-band spectral energy distributions of our sample of six LMC globular clusters. The black solid lines indicate the most closely matching (in age and metallicity) stellar population model of Maraston (2005); i.e. age = 13 Gyr, [Z/H] = −1.35 for NGC 1754, NGC 2005, and NGC 2019, age = 2 Gyr, [Z/H] = −0.33 for NGC 2173, and age = 1.5 Gyr, [Z/H] = −0.33 for NGC 1806 and NGC 2162. The spectra are normalised to the flux at 1.25 μm. Note the prominent spectral shape differences in the J- and H-bands between old and intermediate age clusters. The shaded areas indicate the regions with contamination by strong OH and O2 sky line residuals. |
| In the text | |
|
Fig. 3 Top panel: spectrum of NGC 1806 with overplotted central passband (red) and the classical continuum region (blue) for the C2 index (Maraston 2005). In orange we overplot the new continuum region for the C2 index defined in this paper (see Sect. 4). Bottom panel: comparison between the classical and the redefined C2 index, measured on our own LMC star observations (solid black and red symbols), as well as the stars from the Milky Way spectral libraries of Lançon & Mouhcine (2002, orange) and Rayner et al. (2009, black diamonds, green squares, red asterisks). The dashed line shows the one-to-one relation, the solid line represents a linear least squares fit to all data points. |
| In the text | |
|
Fig. 4 Comparison between C2 index values and the models of Maraston (2005). The ages of the clusters are the mean ones from Table 1 with error bars reflecting the rms. For guidance, in the top panel we reproduce the K-band DCO index from Paper I (their Fig. 9). In both panels with black arrows we indicated how the spectrum of NGC 2173 changes when adding different fractions of LMC carbon star light to it. The red arrows indicate the changes in the same spectrum, but adding different fractions of the averaged Milky Way carbon star spectrum of Lançon & Mouhcine (2002). See text for a detailed description. |
| In the text | |
|
Fig. 5 DCO(left) and C2(right panel) indices versus (J − K) colour for stars in the Milky Way and the LMC. The oxygen- and carbon-rich LMC stars (filled black and red dots, respectively) are from our own SINFONI observations, the K (green open squares), M (black diamonds), C (red asterisks), and S (red asterisks with square around) stars are taken from the SpeX library of Rayner et al. (2009). The C-rich spectra in the Milky Way (orange crosses) are taken from the library of Lançon & Mouhcine (2002). Typical error bars are shown in the upper right corner of the left panel. In the left panel, the solid line denotes the relation for LMC carbon-rich stars from Lyubenova et al. (2010, Eq. (3)), the dashed line (Eq. (5) in the same paper) represents the relation for the Milky Way spectra of Lançon & Mouhcine (2002). |
| In the text | |
|
Fig. 6 DCO vs. C2 index for stellar and globular cluster spectra. Origin of spectra, symbols and colours as in Fig. 5. Error bars are about the size or smaller than the symbols, thus they are not explicitly shown. Coloured triangles show the measurements for the integrated spectra of LMC globular clusters. |
| In the text | |
Current usage metrics show cumulative count of Article Views (full-text article views including HTML views, PDF and ePub downloads, according to the available data) and Abstracts Views on Vision4Press platform.
Data correspond to usage on the plateform after 2015. The current usage metrics is available 48-96 hours after online publication and is updated daily on week days.
Initial download of the metrics may take a while.