Free Access
Fig. 6
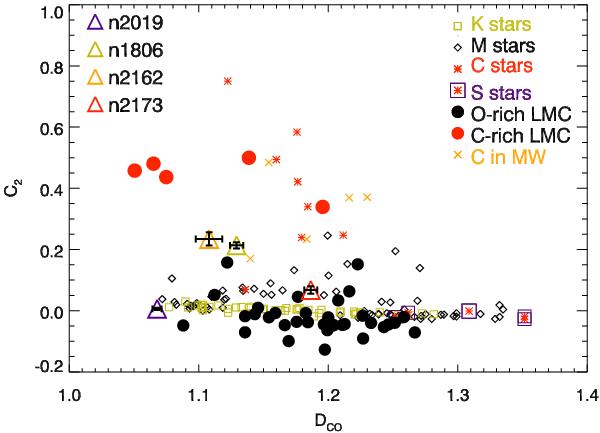
DCO vs. C2 index for stellar and globular cluster spectra. Origin of spectra, symbols and colours as in Fig. 5. Error bars are about the size or smaller than the symbols, thus they are not explicitly shown. Coloured triangles show the measurements for the integrated spectra of LMC globular clusters.
Current usage metrics show cumulative count of Article Views (full-text article views including HTML views, PDF and ePub downloads, according to the available data) and Abstracts Views on Vision4Press platform.
Data correspond to usage on the plateform after 2015. The current usage metrics is available 48-96 hours after online publication and is updated daily on week days.
Initial download of the metrics may take a while.