Fig. 3
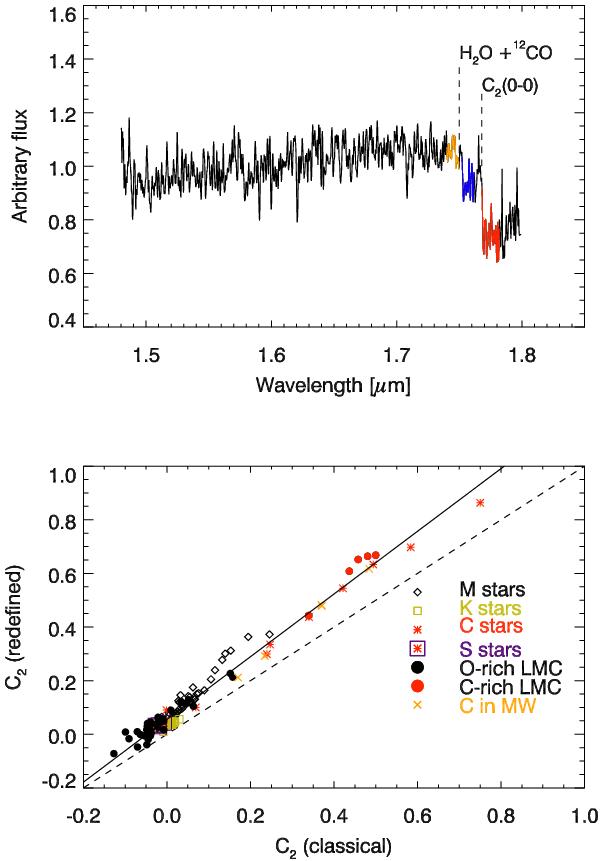
Top panel: spectrum of NGC 1806 with overplotted central passband (red) and the classical continuum region (blue) for the C2 index (Maraston 2005). In orange we overplot the new continuum region for the C2 index defined in this paper (see Sect. 4). Bottom panel: comparison between the classical and the redefined C2 index, measured on our own LMC star observations (solid black and red symbols), as well as the stars from the Milky Way spectral libraries of Lançon & Mouhcine (2002, orange) and Rayner et al. (2009, black diamonds, green squares, red asterisks). The dashed line shows the one-to-one relation, the solid line represents a linear least squares fit to all data points.
Current usage metrics show cumulative count of Article Views (full-text article views including HTML views, PDF and ePub downloads, according to the available data) and Abstracts Views on Vision4Press platform.
Data correspond to usage on the plateform after 2015. The current usage metrics is available 48-96 hours after online publication and is updated daily on week days.
Initial download of the metrics may take a while.