Fig. 1
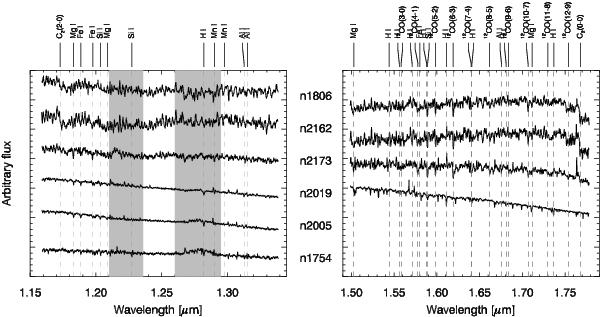
Left panel: J-band, integrated spectra of the six LMC globular clusters. The shaded areas indicate the regions with contamination by strong OH and O2 sky line residuals. Right panel: H-band, integrated spectra of four of the LMC clusters. Due to unstable atmospheric conditions, the H-band spectra of NGC 1754 and NGC 2005 are heavily contaminated by sky line residuals and thus exibit a very low S/N and are not shown. Each spectrum is normalised to its median value. Line identifications are based on the stellar spectral atlases by Lançon & Rocca-Volmerange (1992), Wallace et al. (2000) and Rayner et al. (2009).
Current usage metrics show cumulative count of Article Views (full-text article views including HTML views, PDF and ePub downloads, according to the available data) and Abstracts Views on Vision4Press platform.
Data correspond to usage on the plateform after 2015. The current usage metrics is available 48-96 hours after online publication and is updated daily on week days.
Initial download of the metrics may take a while.