Fig. 4
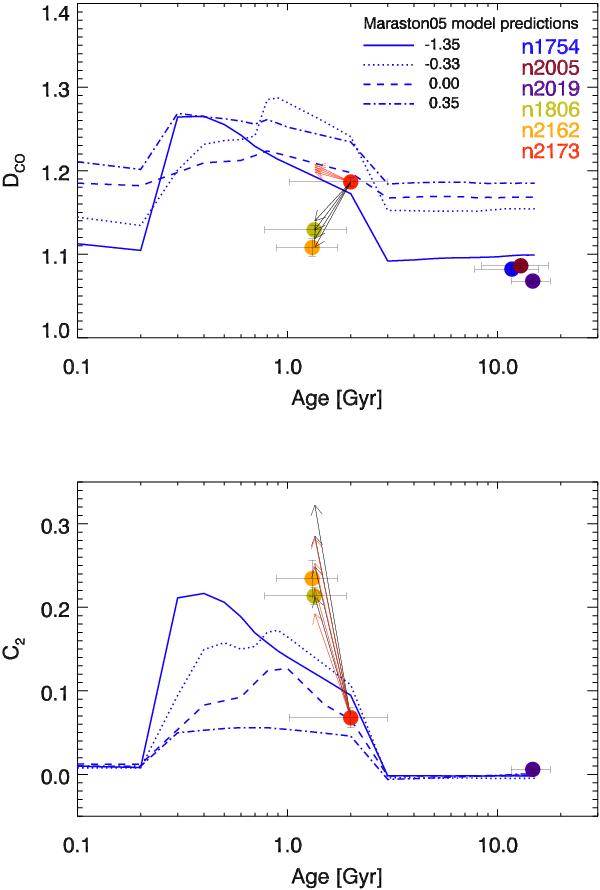
Comparison between C2 index values and the models of Maraston (2005). The ages of the clusters are the mean ones from Table 1 with error bars reflecting the rms. For guidance, in the top panel we reproduce the K-band DCO index from Paper I (their Fig. 9). In both panels with black arrows we indicated how the spectrum of NGC 2173 changes when adding different fractions of LMC carbon star light to it. The red arrows indicate the changes in the same spectrum, but adding different fractions of the averaged Milky Way carbon star spectrum of Lançon & Mouhcine (2002). See text for a detailed description.
Current usage metrics show cumulative count of Article Views (full-text article views including HTML views, PDF and ePub downloads, according to the available data) and Abstracts Views on Vision4Press platform.
Data correspond to usage on the plateform after 2015. The current usage metrics is available 48-96 hours after online publication and is updated daily on week days.
Initial download of the metrics may take a while.