Fig. 3
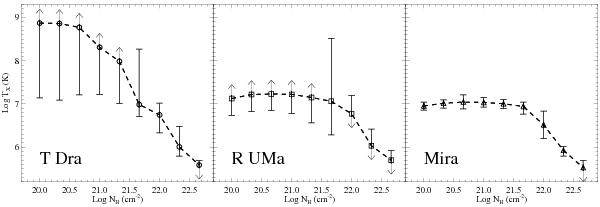
Best-fit X-ray temperatures as functions of the hydrogen column density for T Dra (squares), R UMa (dots), and Mira (triangles). The 90% confidence range is indicated by the flat-tipped error bars, while an unconstrained value is indicated by the arrow-tipped error bars. The behavior of the fits reflects the limitations of ROSAT spectra for hard and low count rate sources.
Current usage metrics show cumulative count of Article Views (full-text article views including HTML views, PDF and ePub downloads, according to the available data) and Abstracts Views on Vision4Press platform.
Data correspond to usage on the plateform after 2015. The current usage metrics is available 48-96 hours after online publication and is updated daily on week days.
Initial download of the metrics may take a while.