| Issue |
A&A
Volume 541, May 2012
|
|
|---|---|---|
| Article Number | A47 | |
| Number of page(s) | 14 | |
| Section | Interstellar and circumstellar matter | |
| DOI | https://doi.org/10.1051/0004-6361/201118658 | |
| Published online | 26 April 2012 | |
EVN observations of 6.7 GHz methanol maser polarization in massive star-forming regions⋆
1 Argelander-Institut für Astronomie der Universität Bonn, Auf dem Hügel 71, 53121 Bonn, Germany
e-mail: This email address is being protected from spambots. You need JavaScript enabled to view it.
2 Joint Institute for VLBI in Europe, Postbus 2, 7990 AA Dwingeloo, The Netherlands
3 Chalmers University of Technology, Onsala Space Observatory, 43992 Onsala, Sweden
4 Sterrewacht Leiden, Leiden University, Postbus 9513, 2300 RA Leiden, The Netherlands
5 Max-Planck Institut für Radioastronomie, Auf dem Hügel 69, 53121 Bonn, Germany
6 National Astronomical Research Institute of Thailand, Ministry of Science and Technology, Rama VI Rd., 10400 Bangkok, Thailand
Received: 16 December 2011
Accepted: 14 March 2012
Abstract
Context. The role of magnetic fields in the formation of high-mass stars is still under debate, and recent measurements of their orientation and strength by using polarized maser emissions are contributing new insights. Masers polarization, in particular of the 6.7-GHz methanol masers, are one of the best probes of the magnetic field morphologies around massive protostars.
Aims. Determining the magnetic field morphology around an increasing number of massive protostars at milliarcsecond resolution by observing 6.7-GHz methanol masers is crucial to better understand the role of magnetic fields in massive star formation.
Methods. The First EVN Group consists of 4 massive star-forming complexes: W51, W48, IRAS 18556+0138, and W3(OH). These contain well-studied H ii regions from some of which molecular bipolar outflows were also detected (W51–e2, G35.20-0.74N). Nine of the European VLBI Network (EVN) antennas were used to measure the linear polarization and Zeeman-splitting of the 6.7-GHz methanol masers in the star-forming regions of the First EVN Group.
Results. We detected a total of 154 CH3OH masers, one third of these towards W3(OH). Fractional linear polarization (1.2–11.5%) was detected towards 55 CH3OH masers. The linear polarization vectors are well-ordered in all the massive star-forming regions. We measured significant Zeeman-splitting in 3 massive star-forming regions (W51, W48, and W3(OH)) revealing a range of separations −3.5 m s-1 < ΔVz < 3.8 m s-1 with the smallest |ΔVz| = 0.4 m s-1. We were also able to compare our magnetic field results with those obtained from submillimeter wavelength dust observation in W51 and show that the magnetic field at low and high resolutions are in perfect agreement.
Key words: stars: formation / masers / polarization / magnetic fields
Tables 1–5 are available in electronic form at http://www.aanda.org
Member of the International Max Planck Research School (IMPRS) for Astronomy and Astrophysics at the Universities of Bonn and Cologne.
© ESO, 2012
1. Introduction
A number of different scenarios have been proposed to explain the formation of stars with masses larger than about 8 M⊙. These include formation through the merger of less massive stars (coalescence model; e.g., Bally & Zinnecker 2005) or through the accretion of unbound gas from the molecular cloud (competitive accretion model; e.g., Bonnell et al. 2004). In the third scenario, the core accretion model, massive stars form through gravitational collapse, which involves disc-assisted accretion to overcome radiation pressure (e.g., McKee & Tan 2003). This scenario is similar to the favored picture of low-mass star formation, in which magnetic fields are thought to regulate the collapse, to transfer the angular momentum and to power the bipolar outflows. Moreover, during the formation of low-mass stars the gravitational collapse of molecular clouds proceeds preferentially along the magnetic field lines, giving rise to large rotating disc or torus structures orthogonal to the magnetic field (e.g., Matsumoto & Tomisaka 2004). Consequently, the molecular bipolar outflows, which originate from the protostar, are driven parallel to the original magnetic field orientation. Although the magnetic fields play such an important and crucial role in the formation of low-mass stars, their role in the formation of high-mass stars is still under debate. Fairly recently magnetic fields have been included in the theoretical simulations of high-mass star formation (e.g. Banerjee & Pudritz 2007). Therefore, providing new measurements of magnetic fields orientation and strength at milliarcsecond (mas) resolution is fundamental to understand the formation process of high-mass stars.
Current dust observations of magnetic fields in massive star-forming regions are often limited to low density regions and/or envelopes at scales of several thousands astronomical units (e.g., Koch et al. 2010). Linear polarization observations of dust also only provide information on the magnetic field in the plane of the sky, so these observations have been yet unable to probe the strength and the full structure of the magnetic field close to the protostars and around protostellar discs (e.g., Tang et al. 2010).
The best probes of magnetic fields in the high density regions close to massive protostars currently available are masers. Their bright and narrow spectral line emission is ideal for measuring the Zeeman-splitting even though the exact proportionality between the measured splitting and the magnetic field strength is still uncertain (see Vlemmings et al. 2011), as well as for determining the orientation of the magnetic field in 3-dimension (e.g., Vlemmings et al. 2010). Recently 6.7-GHz CH3OH masers, which are the most abundant maser species in massive star-forming regions, have started to play a crucial role in determining the magnetic field morphology close to massive protostars (e.g., Vlemmings et al. 2006; 2010; Surcis et al. 2009; 2011a). The CH3OH masers probe magnetic fields along outflows and on surfaces of tori (Surcis et al. 2009; Vlemmings et al. 2010; Surcis et al. 2011a). Therefore, determining the magnetic field morphology around a large number massive protostars by observing the polarized emission of 6.7-GHz CH3OH masers is of fundamental importance. Here we show the results of our First EVN Group composed of 4 massive star-forming regions, which are described in details in Sect. 2. Observations of a second group of 5 sources are in the process of being analyzed.
2. The first EVN group
We selected a first group of 4 massive star-forming regions among the northern hemisphere sources observed with the Effelsberg 100-m telescope where 6.7-GHz CH3OH maser Zeeman-splitting was measured (Vlemmings 2008). The sources were selected based on their peak flux density to allow potential detection of Zeeman-splitting in several individual CH3OH maser features.
2.1. W51
The W51 complex is one of the most luminous star-forming regions in the first quadrant of the Galactic plane. The high luminosity comes from a large number of O-type stars that are within the molecular cloud (Bieging 1975; Carpenter & Sanders 1998). Kundu & Velusamy (1967) found that W51 is divided in four different regions: W51A, W51B, W51C, and W51D. These regions are composed of several sub-regions, for instance W51A consists of G49.4-0.3 and G49.5-0.4 (e.g., Kang et al. 2010). Moreover, G49.5-0.4 comprises the sources W51-Main/south (it contains the UCH ii regions W51–e1 and W51–e2; e.g., Gaume et al. 1993), W51–IRS1, and W51–IRS2 (it contains W51–d2; e.g., Lacy et al. 2007).
W51–e1/e2. W51–e1 and W51–e2 (Vlsr = 59 km s-1) are the brightest molecular cores located at a distance of 5.41 kpc (Sato et al. 2010) in the eastern edge of W51. Their masses are ~150 M⊙ and ~110 M⊙, respectively (Zhang & Ho 1997). Observations of molecular lines showed evidence for infalling, or accreting, gas with a possible rotation around W51-e2 (e.g., Zhang et al. 1998; Sollins et al. 2004; Keto & Klaassen 2008). Keto & Klaassen (2008) suggested a possible bipolar outflow along the north-west and south-east direction from W51-e2 (PA ≈ 150°), which appears to be along the rotation axis of the ionized disc.
OH maser polarization observations reveal that W51–e2 has two Zeeman pairs implying a magnetic field strength of about − 20 mG (Argon et al. 2002). Vlemmings (2008) measured a Zeeman-splitting of the 6.7-GHz CH3OH maser ΔVZ = 0.72 ± 0.04 m s-1. Submillimeter Array (SMA) observations revealed that the inferred B ⊥ morphology is hourglass-like near the collapsing core of W51–e2, with its pinched direction parallel to the direction of the ionized accretion (Tang et al. 2009).
W51–IRS2. W51–IRS2 is the most luminous massive star-forming region in the Milky Way (Erickson & Tokunaga 1980) and it is located at a distance of  kpc (Xu et al. 2009). W51–IRS2 hosts a young O5-type protostar and an UCH ii region called W51–d2 (e.g., Gaume et al. 1993; Zapata et al. 2008). W51–d2 is located west w.r.t. the H2O maser complex called W51-north at a projected distance of about 17 000 AU. The source is associated with NH3 and CH3OH masers as well as H2O masers (Gaume et al. 1993; Minier et al. 2001; Eisner et al. 2002; Phillips & van Langevelde 2005).
2.2. W48
The W48 complex is located in the Carina-Sagittarius spiral arm at a distance of 3.27 kpc (Zhang et al. 2009). Onello et al. (1994) showed that W48 consists of five H ii regions: W48A-E. W48A hosts a cometary UCH ii region called G35.2 − 1.74 that is believed to be a site of massive star formation (Wood & Churchwell 1989; Roshi et al. 2005), and two infrared sources IRS 1 and IRS 2 (Zeilik & Lada 1978). CH3OH masers are associated with G35.2–1.74 (Caswell et al. 1995; Minier et al. 2000). The CH3OH maser region shows a ring-like structure of ~200 × 400 mas along a direction north-south. The mid-infrared source MIR 3 corresponds to G35.2–1.74 and it is quite predominant in the mid-infrared images of De Buizer et al. (2005). MIR 1 coincides with the OH and H2O masers site.
Vlemmings (2008) measured a Zeeman-splitting of the CH3OH masers of 0.32 ± 0.02 m s-1. Submillimeter polarimetry observations with the Submillimetre Common User Bolometer Array (SCUBA) revealed two cores, the main and bright core in the east, W48main, and the small core in the west, W48W (Curran et al. 2004). The two cores appear to be connected by a ridge of dust and gas. The degree of polarization is lower (0.5%) towards the intensity peak of W48main, which is close to G35.2 − 1.74, and is higher towards the edges. Moreover, the magnetic field orientation is complicated and near the CH3OH maser region, towards the centre of W48main, the magnetic field has a NW-SE orientation. Whereas, in W48W the magnetic field has an ordered orientation north-south. This changing in the orientation has been explained by twisting of the magnetic field towards the centre of W48main (Curran et al. 2004).
2.3. IRAS 18556+0138
IRAS 18556+0138 is at a distance of 2.19 kpc (Zhang et al. 2009) and has a systemic velocity Vsys ~ 34 km s-1 (Matthews et al. 1984). This IRAS source is associated with the massive star-forming region G35.2–0.74N that contains an embedded B0.5 star with a luminosity of ~104 L⊙ and a stellar mass of ~15 M⊙ (Dent et al. 1985; Gibb et al. 2003). A collimated CO-molecular bipolar outflow (PA = 58°, Gibb et al. 2003) was detected from G35.2–0.74N (e.g., Dent et al. 1985). The outflow has a size of about 2 pc and its blue- (25.3 km s-1
  km s-1) and red-shifted (37.8 km s-1 <
  km s-1) parts are located south-west and north-east w.r.t. the protostar (López-Sepulcre et al. 2009), respectively. A radio/infrared jet was detected with a position angle PA ~ 0° (Fuller et al. 2001; De Buizer 2006) suggesting that the outflow is driven by the precessing jet (e.g.; Martí et al. 1993). In addition, a flattened structure rotating perpendicularly (PA = 148°) to the outflow axis was also observed (e.g., López-Sepulcre et al. 2009). López-Sepulcre et al. (2009) measured a velocity range of the rotating structure between 33.45 km s-1 (NW) and 34.75 km s-1 (SE), and a SE-NW size of ~30″, which at 2.19 kpc correspond to about 66 000 AU (~0.3 pc).
Hutawarakorn & Cohen (1999) measured magnetic field strengths between –2.5 mG, north of G35.2–0.74N, and +5.2 mG, south by studying the Zeeman-splitting of the OH masers. They also found an orientation of the magnetic field parallel to the outflow, even if Faraday rotation could play an important role. Using Effelsberg observations Vlemmings (2008) measured a Zeeman-splitting of the CH3OH maser emission ΔVZ = 0.81 ± 0.04 m s-1.
2.4. W3(OH)
W3(OH) is the most studied UCH ii region in our Galaxy. It is located in the Perseus spiral arm at a distance of 1.95 ± 0.04 kpc (Xu et al. 2006). Infrared and radio continuum observations indicated that the central ionizing star is a O7 star with a mass of about 30 M⊙ (Scott 1981; Campbell et al. 1989). Moscadelli et al. (1999; 2010) derived accurate proper motion of the 12-GHz CH3OH masers of which the most intense concentrate in a small area towards the north (called the northern clump) of the UCH ii region. A second clump is located south, and between the two clumps an isolated single spot maser has been found. This north-south filamentary structure of 12-GHz CH3OH masers is also shown by the 6.7-GHz CH3OH and the OH masers (Harvey-Smith & Cohen 2006). The brightest 12-GHz CH3OH masers of the northern clump are distributed along an axis at PA = 141° and show a regular trend of radial velocities with position, suggesting that they could trace a self-gravitating, low-mass (M ≈ 1.5 M⊙) circumstellar disk (R ≈ 270 AU) in the phase of being photo-evaporated by the strong UV-radiation field escaping from the W3(OH) UCH ii region (Moscadelli et al. 2010). 6.7-GHz CH3OH masers were detected for the first time at high angular resolution by Menten et al. (1992) and they coincide with the masers at 12-GHz (Moscadelli et al. 1999). In particular some 6.7-GHz CH3OH masers trace a similar linear structure as shown by the 12-GHz CH3OH masers (PA = 130°; Harvey-Smith & Cohen 2006).
Polarization observations of the CH3OH masers with MERLIN showed that the magnetic field is parallel to the extended filament but with a complex structure in the dominating northern clump (Vlemmings et al. 2006). Wright et al. (2004) detected linear polarization from the 1.6-GHz OH maser emission, showing a wider spread maser polarization angles, with the median polarization angle  °, that has been attributed to Faraday rotation along the maser path. A Zeeman-splitting of the 6.7-GHz CH3OH masers ΔVZ = 0.141 ± 0.003 m s-1 was measured by Vlemmings (2008).
3. Observations and data reduction
The group was observed at 6.7-GHz in full polarization spectral mode with nine of the European VLBI Network (EVN)1 antennas (Jodrell2, Cambridge, Effelsberg, Onsala, Medicina, Torun, Noto, Westerbork, and Yebes-40 m), for a total observation time of 20 h, on November 2 (W48, IRAS 18556+0138, and W3(OH)) and 3 (W51), 2009 (program codes ES063A and ES063B). The bandwidth was 2 MHz, providing a velocity range of ~100 km s-1. The data were hardware-correlated with the Joint Institute for VLBI in Europe (JIVE) correlator (Schilizzi et al. 2001) using 1024 channels and generating all 4 polarization combinations (RR, LL, RL, LR) with a spectral resolution of 1.9 kHz (~0.1 km s-1). In order to detected CH3OH maser towards both W51–e1/e2 and W51–IRS2 the data of W51 were correlated twice with two different correlator positions. The correlator position of W51–e1/e2 was the pointing position of the observations.
The data were edited and calibrated using AIPS. The bandpass, the delay, the phase, and the polarization calibration were performed on the calibrators J2202+4216 (W48 and W51) and 3C 286 (IRAS 18556+0138 and W3(OH)). Fringe-fitting and self-calibration were performed on the brightest maser feature of each star-forming region. Then the I, Q, U, RR, and LL cubes were imaged (2 arcsec × 2 arcsec, rms ranges from 4 mJy beam-1 to 50 mJy beam-1 depending on the source) using the AIPS task IMAGR. The beam-sizes were 5.5 mas × 4.5 mas for W51, 6.8 mas × 5.4 mas for W48, 7.5 mas × 4.8 mas for IRAS 18556+0318, and 8.7 mas × 4.1 mas for W3(OH). The Q and U cubes were combined to produce cubes of polarized intensity ( ) and polarization angle (χ = 1 / 2 × atan(U / Q)). The EVN observations were obtained close to VLA polarization observations2 made by the NRAO at the beginning of November 2009, during which the polarization angles of J2202+4216 and 3C 286 were ~−29°.2 and ~11°.5 respectively. Hence, we were able to estimate the polarization angles with a systemic error of no more than ~3°. The formal error on χ are due to thermal noise. This error is given by σχ = 0.5 σP / P × 180° / π (Wardle & Kronberg 1974), where P and σP are the polarization intensity and corresponding rms error respectively. We were able to obtain the absolute position of the brightest features of W51–e2, W51–IRS2, and W3(OH) through fringe rate mapping using the AIPS task FRMAP. The absolute position errors were less than 30 mas.
4. Analysis
We identified the CH3OH maser features using the process described in Surcis et al. (2011a,b). The maser features that showed linear polarization emission were fitted by using the adapted full radiative transfer method code for CH3OH masers described in Surcis et al. (2011a) and based on the models for H2O masers of Nedoluha & Watson (1992). The fit provides the emerging brightness temperature (TbΔΩ) and the intrinsic thermal linewidth (ΔVi). We modeled the observed linear polarized and total intensity maser spectra by gridding ΔVi from 0.5 to 1.95 km s-1. Considering TbΔΩ and Pl we determined the angles between the maser propagation direction and the magnetic field (θ), if θ > θcrit = 55°, where θcrit is the Van Vleck angle, the magnetic field appears to be perpendicular to the linear polarization vectors, otherwise it is parallel. We determined the Zeeman-splitting (ΔVZ) from the cross-correlation between the RR and LL spectra, like was successfully used in Surcis et al. (2009, 2011b) for the polarized CH3OH maser emission detected in W75N and NGC 7538. The dynamic range of the RR and LL cubes decreases close to the strongest maser emission of each group because of the residual calibration errors. As a result, we were not able to determine ΔVZ for any CH3OH maser features of W3(OH) with a peak flux less than ~15 Jy beam-1.
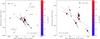 |
Fig. 1 Left panel: a view of the CH3OH maser features detected around W51–e2. Right panel: a zoom-in view of the boxed region of the left panel. The triangles symbols are the identified CH3OH maser features scaled logarithmically according to their peak flux density (Table 1). The maser LSR radial velocity is indicated by color. A 6 Jy beam-1 symbol is plotted for illustration in both panels. The linear polarization vectors, scaled logarithmically according to polarization fraction Pl, are overplotted. The two arrows indicate the direction of the bipolar outflow (PA ~ 150°; Keto & Klaassen 2008). The dashed line is the best linear fit of the CH3OH maser features in the right panel (PA = 57°). |
5. Results
In Tables 1–5 (see online material) we list all the 154 CH3OH maser features detected towards the 4 massive star-forming regions observed with the EVN. The description of the maser distributions and the polarization results are reported for each source separately in Sects. 5.1–5.4.
5.1. W51
We detected 6.7-GHz CH3OH maser emission in the star-forming region W51–e1/e2 and W51–IRS2. In particular, 37 features towards W51–e2 (named as W51E.01-W51E.37 in Table 1) and 18 towards W51–IRS2 (named as W51N.01-W51N.18 in Table 2). No CH3OH maser emission (8σ = 0.1 Jy beam-1) was detected around W51–e1.
W51–e2. In Fig. 1 we show the CH3OH maser features colour-coded according to the LSR radial velocities (50 km s-1 < Vlsr < 61 km s-1). The maser features near the 870 μm continuum peak (Tang et al. 2009) lie in an elongated structure (PA = 57°) perpendicular to the molecular bipolar outflow (PA ~ 150°; Keto & Klaassen 2008) and close to the ionized accreting flow direction (PA ~ 30°; Keto & Klaassen 2008). This suggests that the masers potentially trace a disc structure perpendicular to the bipolar outflow. However, the velocities of the CH3OH maser features are consistent with the velocities at the centre of the H53α emission, which traces the rotating flow (Keto & Klaassen 2008). This suggests that the masers might probe material that is being accreted onto the disc itself, like in Cepheus A and NGC 7538 (Vlemmings et al. 2010; Torstensson et al. 2011; Surcis et al. 2011a), rather than the disc material.
We detected linearly polarized emission (Pl = 1.2%−4.0%) in 16 CH3OH maser features that are all located close to the centre of W51–e2. The error weighted linear polarization angle is ⟨ χ ⟩ W51−e2 = 33° ± 16°. The full radiative transfer method code for CH3OH masers was able to fit 14 features. The intrinsic thermal linewidths and the emerging brightness temperatures are given in Cols. 9 and 10 of Table 1 and their weighted values are  km s-1 and ⟨ TbΔΩ ⟩ W51 − e2 ≈ 109 K sr, respectively. The angles between the maser propagation direction and the magnetic field (θ) are almost constant for all the CH3OH maser features. The feature W51E.17 shows θ = 90° indicating that the feature could be partially saturated. Hence, excluding this feature, ⟨ θ ⟩ W51 − e2 = 79°
 . Since θ > θcrit = 55° the magnetic field is most likely perpendicular to the linear polarization vectors even though it might also be parallel because of the relatively large errors in Col. 12 of Table 1. We measured Zeeman-splitting (Col. 11) in 4 CH3OH maser features. The weighted value is ⟨ ΔVZ ⟩ W51−e2 = −1.6 ± 1.2 m s-1 and in absolute value is twice larger than that measured by Vlemmings (2008).
W51–IRS2. We detected 18 CH3OH maser features with peak flux density between 0.16 mJy beam-1 and 12 mJy beam-1 and with velocities 54 km s-1 < Vlsr < 61 km s-1. The CH3OH maser features, all of which are associated with the UCH ii region d2, seem to lie in an arch structure oriented south-west. We detected linearly polarized emission only towards the brightest maser feature (W51N.11, Pl = 1.3% and χW51−IRS2 = 27° ± 13°). The intrinsic thermal linewidth and the emerging brightness temperature are in Cols. 9 and 10 of Table 2 and the angle θ (Col. 13) indicates that the magnetic field is likely parallel to the linear polarization vector. Indeed, taking into account the errors, θ angles are less than θcrit = 55°. No Zeeman-splitting was measured.
5.2. W48
In Fig. 3 all the 20 CH3OH maser features are shown, named in Table 3 as W48.01–W48.20. The CH3OH maser features appear to be symmetrically distributed, with the red-shifted features (Vlsr > 43 km s-1) located in the north-east and those blue-shifted (Vlsr < 43 km s-1) in the south-west. All the CH3OH maser features are associated with the submillimetre–core W48main detected with SCUBA by Curran et al. (2004) and are closer to MIR3 than to MIR1 implying that the CH3OH maser features are not related to the other two maser species (H2O and OH).
Linearly polarized emission was detected towards 5 CH3OH maser features that show very high linear polarization fraction (Pl = 4.4% − 6.5%). These high values of Pl suggest that the features might be partially saturated. Indeed the emerging brightness temperatures obtained by using the full radiative transfer method code are (for all but W48.10) greater than the limit below which CH3OH maser features can be considered unsaturated, i.e. TbΔΩ = 2.6 × 10⁹ K sr (Surcis et al. 2011a). As reported in Surcis et al. (2011a), the intrinsic thermal linewidth for saturated masers is overestimated so the observed linewidths ΔvL might be equal to ΔVi (Cols. 6 and 9 of Table 3, respectively). The θ angles (Col. 12) are all greater than 55° so the magnetic field is certainly perpendicular to the linear polarization vectors. Zeeman-splitting was measured only for the brightest feature (W48.14) and its value is ΔVZ = 3.8 ± 0.4 m s-1, which is 10 times larger than that measured by Vlemmings (2008).
5.3. IRAS 18556+0318
In Table 4, named as I18556.01–I18556.28, we report all the identified 6.7-GHz CH3OH maser features. In particular, they are associated with the source G35.20-0.74N and they can be divided in two groups (A and B). Group A is composed of 20 CH3OH maser features (27.60 km s-1 < Vlsr < 36.56 km s-1) that seem to be along an arch structure (top panel of Fig. 5), while Group B (27 km s-1 < Vlsr < 29 km s-1) is located about 2.3 arcsec (~5000 AU at 2.19 kpc) south-east of group A and close to the peak of the radio continuum emission shown in De Buizer (2006). The maser distribution coincides with that reported by Sugiyama et al. (2008). The two groups of CH3OH masers seem to be at the ends of a linear structure with PA ~ 140° and a radius of about 5000 AU, which is almost perpendicular to the direction of the CO-outflow (PA = 58°; Gibb et al. 2003). This is suggested by the position angle of this linear structure (PA = 140°) that agrees with the position angles obtained both from the OH maser emission (Hutawarakorn & Cohen 1999) and from the CO18O(2 − 1) emission (López-Sepulcre et al. 2009). If we consider the velocities of the CH3OH and OH masers, of the large flattened structure, of the outflows, and of the source itself we find that the whole picture is quite different. The velocities of the two maser species are in good agreement, both are in the range 21 km s-1 < Vmasers < 37 km s-1, and probably they are tracing the same gas. While the mean radial velocity of the large flattened structure is identical to the LSR velocity of the source ( km s-1, Hutawarakorn & Cohen 1999).
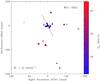 |
Fig. 2 A close-up view of the CH3OH maser features detected around W51–IRS2. The triangles symbols are the identified CH3OH maser features scaled logarithmically according to their peak flux density (Table 2). The maser LSR radial velocity is indicated by color. A 1 Jy beam-1 symbol is plotted for illustration. The linear polarization vectors, scaled logarithmically according to polarization fraction Pl, are overplotted. |
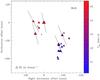 |
Fig. 3 A close-up view of the CH3OH maser features detected around W48 (G35.20–1.74). The triangles symbols are the identified maser features scaled logarithmically according to their peak flux density (Table 3). The maser LSR radial velocity is indicated by color. A 30 Jy beam-1 symbol is plotted for illustration. The linear polarization vectors, scaled logarithmically according to polarization fraction Pl, are overplotted. |
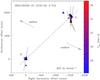 |
Fig. 4 A close-up view of the CH3OH maser features detected around IRAS 18556+0138 (G35.20–0.74N). The triangles symbols are the identified CH3OH maser features scaled logarithmically according to their peak flux density (Table 4). The maser LSR radial velocity is indicated by color. A 6 Jy beam-1 symbol is plotted for illustration. The linear polarization vectors, scaled logarithmically according to polarization fraction Pl, are overplotted. The dashed line is the best linear fit of the CH3OH masers (PA = 140°). The two arrows indicate the direction, but not the origin, of the collimated CO-molecular bipolar outflow (PA = 58°; Gibb et al. 2003). |
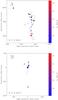 |
Fig. 5 Zoom-in view of the two CH3OH maser clusters of IRAS 18556+0138 (G35.20–0.74N). |
The velocities of group B, which should be at the centre of the linear structure, are about 6 km s-1 blueshifted with respect to  and in the velocity range of the blue-shifted part of the outflow (25.3 km s-1 <
  km s-1). This suggests that group B is associated with the outflow rather than with the linear structure. Also the velocities of group A appear to be in agreement with the outflow velocities (25.3 km s-1 < Voutf − IRAS < 43.8 km s-1) although the arch-like distribution indicates an association with a torus structure. This torus structure might be related to the large flattened structure (33.45 km s-1 < Vtorus − IRAS < 34.75 km s-1).
We detected linear polarization in 5 CH3OH maser features (Pl = 4.8%−11.5%) and the full radiative transfer method code was able to properly fit only two of them (I18556.08 and I18556.11). This is due to the likely high saturation degree of the CH3OH maser features. For the features I18556.01, I18556.04, and I18556.27 the gridding of ΔVi used for fitting the linear polarized and total intensity spectra was insufficient and consequently the code provided only an upper limit for ΔVi. All the emerging brightness temperatures obtained from the fit, except I18556.11, reveal that the features have a high saturation degree. In particular, the reference maser feature I18556.27 shows the highest linear polarization fraction among all the 6.7-GHz CH3OH maser features detected in the whole EVN group (Pl = 11.5%). In G35.20-0.74 the magnetic field is also perpendicular to the linear polarization vectors (θ > 55°). No 6.7-GHz CH3OH maser Zeeman-splitting was measured in this source.
5.4. W3(OH)
W3(OH) is the massive star-forming region towards which we detected one third of all the CH3OH maser features of the First EVN Group. They are listed in Table 5, where they are named as W3OH.01–W3OH.51, and plotted in Fig. 6. They can be divided in six groups (I–VI) and their zoom-in views are shown in Fig. 7. Morphologically the 6.7-GHz CH3OH maser features detected with the EVN show the same filamentary structure observed with MERLIN by Harvey-Smith & Cohen (2006) and no new group of features was observed.
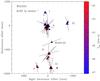 |
Fig. 6 A complete view of the CH3OH maser features detected around W3(OH). The triangles symbols are the identified CH3OH maser features scaled logarithmically according to their peak flux density (Table 5). The maser LSR radial velocity is indicated by color. A 60 Jy beam-1 symbol is plotted for illustration. The linear polarization vectors, scaled logarithmically according to polarization fraction Pl, are overplotted. |
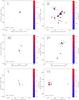 |
Fig. 7 Zoom-in view of the six CH3OH maser groups of W3(OH). The dashed line in panel II is the best linear fit of the central CH3OH maser features (PA = 121°). A, B, and C are used to label three associations of 6.0-GHz OH, 12-GHz CH3OH, and 6.7-GHz CH3OH masers. |
We do not detected the CH3OH maser features located west of the isolated feature W3OH.05 (features 22 and 23 in Harvey-Smith & Cohen 2006). The linear distribution of the central 6.7-GHz CH3OH maser features of group II (PA = 121°) is similar to those of the 12-GHz CH3OH masers (PA = 141°; Moscadelli et al. 2010) and of the OH masers (PA = 130°–140°; Moscadelli et al. 2010), which indicates that all the masers complement each other (Moscadelli et al. 2010). In the top-right panel of Fig. 7 the three associations A, B, and C of 6.0-GHz OH, 12-GHz CH3OH, and 6.7-GHz CH3OH masers are also reported (Moscadelli et al. 2010). Group IV seems to lie in an arch-like structure. The northern clump (groups I, II, and III) shows velocities in absolute value greater of ~ 2−4 km s-1 than the southern clump (groups IV, V, and VI), in particular group V has in absolute value the lowest velocity (Vlsr ≈ −42 km s-1).
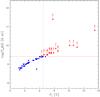 |
Fig. 8 The emerging brightness temperatures (TbΔΩ) as function of the linear polarization fraction (Pl). The blue and red circles indicate the unsaturated and saturated masers, respectively, detected in NGC 7538 (Surcis et al. 2011a), W51, W48, IRAS 18556+0138, and W3(OH). The red arrows indicate that the TbΔΩ values obtained from the radiative transfer method code are lower limits. The red full line is the limit of emerging brightness temperature above which the CH3OH masers are considered saturated (TbΔΩ > 2.6 × 10⁹ K sr; Surcis et al. 2011a), and the dotted line gives the lower limit to the linear polarization fraction for saturated masers (Pl ≈ 4.5%). |
Along the linear structure of group II the distribution of the maser velocities is well ordered, the most blue-shifted velocities are northwestern and the most red-shifted are southeastern. This velocity distribution coincides perfectly with that of the 12-GHz CH3OH masers (Moscadelli et al. 2010).
We have detected linear polarization in more than 50% of the CH3OH maser features (27/51) with linear polarization fraction ranging from 1.2% to 8.1%. The highest Pl corresponds to the brightest maser feature (W3OH.22) that also shows the highest emerging brightness temperature. This value indicates that the feature is partially saturated like 5 other features (W3OH.05, W3OH.10, W3OH.14, W3OH.17, and W3OH.18) that have TbΔΩ > 2.6 × 10⁹ K sr. The error weighted emerging brightness temperature and the weighted intrinsic thermal linewidth of the unsaturated features are ⟨ TbΔΩ ⟩ W3(OH) ≈ 2 × 10⁹ K sr and 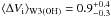 km s-1, respectively. The error weighted linear polarization angle is ⟨ χ ⟩ W3(OH) = 3° ± 39°, while considering only the unsaturated features ⟨ χ ⟩ W3(OH) = 15° ± 31°. The θ values reported in Col. 13 of Table 5 indicate that for some CH3OH maser features (e.g., W3OH.35) the magnetic field is more likely perpendicular to the linear polarization vectors, while for other features it is parallel (e.g., W3OH.09). For 7 CH3OH maser features was possible to measure the Zeeman-splitting of which values are in the range − 3.5 m s-1 < ΔVz < 3.8 m s-1 (Col. 12 of Table 5).
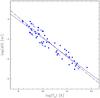 |
Fig. 9 The beaming angle (ΔΩ) as function of the brightness temperatures (Tb) for all the unsaturated CH3OH masers detected in NGC 7538 (Surcis et al. 2011a), W51, W48, IRAS 18556+0138, and W3(OH). The arrows indicate that the masers are unresolved, i.e. the maser angular size Σ is less than the beam-size of the observations and consequently ΔΩ is smaller and Tb is larger. The blue line is the best linear fit of the resolved masers and the dashed black line is the theoretical proportionality ΔΩ ∝ (Tb)-1 (Elitzur 1992). |
6. Discussion
6.1. CH3OH maser properties
Before discussing the magnetic fields, it is worthwhile examining the properties of the CH3OH maser features (or simply CH3OH masers). As reported in Sect. 5 we observed a number of saturated CH3OH masers in our EVN group. If we consider all the 72 CH3OH masers detected in this group and in NGC 7538 for which was possible to determine the emerging brightness temperature (Surcis et al. 2011a), we can estimate the upper limit of linear polarization fraction for unsaturated 6.7-GHz CH3OH masers. In Fig. 8 we report the emerging brightness temperature as function of the linear polarization fraction. From this plot we find that the 6.7-GHz CH3OH masers with Pl ≲ 4.5% are all unsaturated. Furthermore, from the maser theory the beaming angle (ΔΩ) of unsaturated masers is roughly proportional to |τν|-1, which is proportional to the brightness temperature Tb (Elitzur 1992). Consequently, if these masers are unsaturated ΔΩ ∝ (Tb)-1. As shown in Surcis et al. (2011a), we can estimate ΔΩ by comparing the brightness temperature Tb, which is given by ![Mathematical equation: \begin{equation} \frac{T_{\rm{b}}}{[\rm{K}]}=\frac{S(\nu)}{[\rm{Jy}]}\cdot\left(\frac{\Sigma^{2}}{[\rm{mas}^2]}\right)^{-1} \cdot \xi_{\rm{CH_3OH}}, \label{eq71} \end{equation}](/articles/aa/full_html/2012/05/aa18658-11/aa18658-11-eq118.png) (1)with TbΔΩ obtained from the model. In Eq. (1) S(ν) is the flux density, Σ the maser angular diameter, and ξCH3OH = 13.63 × 10⁹ mas2 Jy-1 K. From the Gaussian fit of the masers Σ is between 4 and 8 mas and almost all the CH3OH masers appear resolved. We find that ΔΩ ranges from 3 × 10⁻³ sr to 8 × 10⁻² sr. In Fig. 9 all the values of ΔΩ as function of Tb are reported, both in logarithmic scales. From a linear fit (blue line) we found that ΔΩ ∝ (Tb)-0.9 implying that the CH3OH masers we have taken into account are indeed unsaturated.
(1)with TbΔΩ obtained from the model. In Eq. (1) S(ν) is the flux density, Σ the maser angular diameter, and ξCH3OH = 13.63 × 10⁹ mas2 Jy-1 K. From the Gaussian fit of the masers Σ is between 4 and 8 mas and almost all the CH3OH masers appear resolved. We find that ΔΩ ranges from 3 × 10⁻³ sr to 8 × 10⁻² sr. In Fig. 9 all the values of ΔΩ as function of Tb are reported, both in logarithmic scales. From a linear fit (blue line) we found that ΔΩ ∝ (Tb)-0.9 implying that the CH3OH masers we have taken into account are indeed unsaturated.
6.2. Magnetic fields in the First EVN Group
6.2.1. The importance of magnetic fields in dynamics of massive star formation
We cannot determine the exact magnetic field strengths from our Zeeman-splitting measurements because of the uncertainty of the Landé g-factor of the 6.7-GHz CH3OH transition from which the Zeeman-splitting coefficient αZ is evaluated (Vlemmings et al. 2011). If we knew the magnetic field strengths we could estimate the importance of the magnetic fields by evaluating the ratio between thermal and magnetic energies (β). If β < 1, the magnetic field dominates the energies in high-density protostellar environment.
Despite the uncertainty of the magnetic field strengths affects the β values we can still qualitatively determine if the magnetic fields is important in the dynamics of the massive star-forming regions. Substituting ΔVZ = αZ·B|| in Eq. (12) of Surcis et al. (2011a), where B|| is the magnetic field strength along the line of sight, and by assuming nH2 = 109 cm-3 and TK ~ 200 K, we obtain ![Mathematical equation: \begin{equation} \beta=611.6~\alpha_Z^{2} \,\cos\, \langle\theta\rangle ~\left(\frac{|\Delta V_{\rm{Z}}|}{[\rm{m\,s^{-1}}]}\right)^{-2}\cdot \label{eq73} \end{equation}](/articles/aa/full_html/2012/05/aa18658-11/aa18658-11-eq131.png) (2)Surcis et al. (2011a) argued that a reasonable value for αZ should be in the range 0.005 km s-1 G-1 < αZ < 0.05 km s-1 G-1, consequently from Eq. (2) we can estimate a range of β.
(2)Surcis et al. (2011a) argued that a reasonable value for αZ should be in the range 0.005 km s-1 G-1 < αZ < 0.05 km s-1 G-1, consequently from Eq. (2) we can estimate a range of β.
The three massive star-forming regions that host CH3OH masers that show circular polarization (W51, W48, and W3OH) have β values between 10-4 and 10-1. This indicates that the magnetic fields play an important role in all the three regions despite we cannot exactly determine how much it is because of the uncertainty of Landé g-factor.
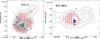 |
Fig. 10 Left: modified version of Fig. 5a of Tang et al. (2009). The magnetic field (red segments) detected with the SMA (angular resolution |

6.2.2. Magnetic field orientations
The measurements of the linear polarization angles (χ) might be disturbed by the rotation of the linear polarization vectors due to the medium between the source and the observer. This rotation is the foreground Faraday rotation given by Eq. (6) of Surcis et al. (2011a). Assuming the interstellar electron density and the magnetic field are ne ≈ 0.012 cm-3 and B|| ≈ 2 μG (Sun et al. 2008), Φf for the 6.7-GHz CH3OH masers can be written as: ![Mathematical equation: \begin{equation} \Phi_{\rm{f}}[^{\circ}]=2.26~\left(\frac{D}{[\rm{kpc}]}\right), \label{eq72} \end{equation}](/articles/aa/full_html/2012/05/aa18658-11/aa18658-11-eq141.png) (3)i.e. the farther the maser source is, the larger Φf is. This means that the foreground Faraday rotation is estimated to lie between
(3)i.e. the farther the maser source is, the larger Φf is. This means that the foreground Faraday rotation is estimated to lie between  ° and
° and  °.
°.
The quite perfect alignment of the linear polarization vectors of the CH3OH masers in W51–e2 suggests that the internal Faraday rotation is negligible. Whereas the alignments of the vectors in W48 and IRAS 18556+0318 additionally implies that the saturation state of the masers does not affect the linearly polarized emission. Indeed the internal Faraday rotation can destroy the linear polarization (Fish & Reid 2006) but we measured a quite high linear polarization fraction (~5%) in all the saturated CH3OH masers in W48 and IRAS 18556+0318. Hence, the contribution of the internal Faraday rotation must be negligible both in unsaturated and in saturated CH3OH masers as suggested by the alignments of the linear polarization vectors.
W51. Because ⟨ θ ⟩ W51 − e2 = 79° > θcrit the magnetic field around W51–e2 is on the plane of the sky with a position angle of ~ 120° that is perfectly perpendicular to the ionized accretion flow (PA ~ 30°; Keto & Klaassen 2008) rather than to the linear distribution. The linearly polarized emission has been detected close to the 870 μm continuum peak and so the CH3OH masers are probing the magnetic field at the centre of the hourglass morphology mapped by Tang et al. (2009) with the SMA. In Fig. 10 we superimposed the results obtained by Tang et al. (2009) with an angular resolution  (~4000 AU) and by us (~5.4 AU). Here we can see that the magnetic field derived from the CH3OH masers (green segments) is consistent with the hourglass morphology (red segments). The negative value of the Zeeman-splitting indicates that the magnetic field is oriented towards the observer.
In the case of W51–IRS2  ° indicating that the magnetic field is more likely parallel to the linear polarization vectors than perpendicular. Consequently we have also here a perfect agreement with the magnetic field detected with the SMA at 870 μm by Tang et al. (priv. comm.; Fig. 10), implying a well-ordered magnetic field around d2.
W48. A comparison between the magnetic fields derived from the 6.7-GHz CH3OH maser observations and from the SCUBA 850 μm observations (Curran et al. 2004) shows that, like in W51, the magnetic fields are consistent towards the core at different angular resolution. The positive Zeeman-splitting (|ΔVZ|W48 = 3.8 m s-1) indicates that the magnetic field is oriented away from the observer.
IRAS 18556+0318. Four masers of group A show linearly polarized emission from which the magnetic field is estimated to be oriented east-west (PA = 90°). However, because of the velocity difference among the masers it is worthwhile to determine the orientation of the magnetic field separately by considering the masers two by two. Considering I18556.04 and I18556.11, which have velocities 7 km s-1 greater than I18556.01 and I18556.08, the magnetic field is estimated to have PA = 112°, while from the other two masers we estimated PA = 83°. From group B we get PA = 80°. In all cases the magnetic field derived from the 6.7-GHz CH3OH masers is aligned neither with the outflow nor with the linear structure, but is almost perpendicular to the radio/infrared jet.
6.2.3. W3(OH)
Since we observed at higher angular resolution than Vlemmings et al. (2006) we are able to better determine the magnetic field morphology in group II. Comparing Fig. 2 of Vlemmings et al. (2006) and our Fig. 6 we see that the linear polarization vectors of the 6.7-GHz CH3OH masers are not as similar through the whole filamentary structure as observed with the MERLIN, probably because of the 90°-flip phenomenon. However, they appear well ordered within each group (Fig. 7) and this again indicate that the saturation state of the masers does not influence the linearly polarized emission.
Groups III, V, and VI show error weighted linear polarization angles ⟨χ⟩ close to 0°. A comparison with the results obtained by Vlemmings et al. (2006), who did not detect any linearly polarized emission from group V, indicates that the orientation of the linear polarization vectors in these groups are likely influenced by the 90°-flip phenomenon, in particular for group III. Althought the 90°-flip seems to be confirmed from the θ angles measured by us for all the three groups (Col. 14 of Table 5), in groups V and VI the magnetic field is more likely perpendicular to the vectors, i.e. with orientation west-east. Whereas in group III the magnetic field has an orientation north-south. In group IV we see that all the features but
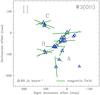 |
Fig. 11 Modified version of panel II of Fig. 7. The green segments, which are scaled logarithmically according to polarization fraction Pl, mark the direction of the magnetic field as derived from the linearly polarized emission of the CH3OH masers in the northern clump of W3(OH). |
W3OH.18 and W3OH.25 show a linear polarization angle similar to that measured by Vlemmings et al. (2006). The different angles of W3OH.18 and W3OH.25 could also be due to the 90°-flip and consequently we find that here, like in group III, the magnetic field is oriented almost north-south. This orientation of the magnetic field is also determined from the isolated feature W3OH.05 of which linear polarization angle agrees quite perfectly with that measured with MERLIN. While the magnetic field of groups III and VI has an orientation along the filamentary structure, the magnetic field morphology in group II is completely different.
For all the CH3OH masers of the group II-B that have χ close to 0° (W3OH.22, W3OH.23, W3OH.35, W3OH.37, and W3OH.39) we find, considering the errors, that their θ angles are likely greater than 55°, indicating that the magnetic field is perpendicular to the large-scale filamentary structure and almost aligned with the linear distribution of the B association. This orientation of the magnetic field is also suggested by the masers that have linear polarization vectors parallel to the linear structure (W3OH.24 and W3OH.28) that show θmin < 55°, i.e. magnetic field is likely parallel to them. As show in Fig. 11, the CH3OH masers of A and C associations (W3OH.27, W3OH.31, W3OH.41, W3OH.42, and W3OH.43) seems to trace a magnetic field that is changing its morphology from a north-south orientation to a west-east close to the linear structure (B association).
From the Zeeman-splitting measurements we can determine the pointing direction of the magnetic fields. Let consider first group II. Since we measured both positive (W3OH.22) and negative (W3OH.35 and W3OH.37) Zeeman-splittings at the north-west end and at the south-east end of the linear distribution respectively, the magnetic field must have a counterclockwise direction. This direction is opposite to the rotation of the linear distribution, which is clockwise as derived from the OH and CH3OH masers velocities. If the masers along the linear distribution trace a disc that is rotating clockwise (M ≈ 1.5 M⊙ and R ≈ 270 AU; Moscadelli et al. 2010), we have in W3(OH) a scenario similar to that of NGC 7538 (Surcis et al. 2011a). The magnetic field is on the disc (in NGC 7538 on the torus) rotating in opposite direction to the disc. The Zeeman-splitting measurements of the other groups suggest that the magnetic field is twisted along the filamentary structure.
7. Conclusions
We observed a group of 4 massive star-forming regions at 6.7-GHz in full polarization spectral mode with the EVN to detect linear and circular polarization emission from the CH3OH masers. We detected a total of 154 6.7-GHz CH3OH masers one third of which only towards W3(OH). We detected linearly polarized emission in all the regions of the EVN group, and in 3 of them we also measured Zeeman-splitting. From our observations we have found that the magnetic field is well ordered in all the massive star-forming regions. In W51-e2 the magnetic field derived from the CH3OH masers is at the centre and along the axis of symmetry of the hourglass morphology observed with the SMA at 870 μm. In W3(OH) we determined two different magnetic fields, one twisted along the filamentary structure and the other one in the northern clump on the likely low-mass rotating disc probed by the linear distribution of the CH3OH and OH masers with a counterclockwise orientation. In the case of IRAS 18556+0318 (G35.20–0.74N) the magnetic field seems to be perpendicular to the radio/infrared jet rather than along the outflow or along a possible torus structure. The magnetic fields are in perfect agreement with their morphology at lower angular resolution determined with the SMA and SCUBA (W51–e2, W51–d2, and W48) and they play an important role in all the massive star-forming regions of the First EVN Group.
In addition, we have also estimated a limit of linear polarization fraction of 4.5% below which the 6.7-GHz CH3OH masers are unsaturated.
Online material
All 6.7-GHz methanol maser features detected in W51–e2.
All 6.7-GHz methanol maser features detected in W51–IRS2.
All 6.7 GHz methanol maser features detected in W48.
All 6.7 GHz methanol maser features detected in IRAS 18556+01 (G35.20–0.74N).
All 6.7-GHz methanol maser features detected in W3(OH).
The European VLBI Network is a joint facility of European, Chinese, South African and other radio astronomy institutes funded by their national research councils.
Acknowledgments
We wish to thank an anonymous referee for making useful suggestions that have improved the paper. G.S. and W.H.T.V. acknowledge support by the Deutsche Forschungsgemeinschaft (DFG) through the Emmy Noether Reseach grant VL 61/3-1. G.S. thanks Y.-W. Tang for providing the SMA continuum and polarization maps of W51-e1/e2 and W51-north.
References
- Argon, A. L., Reid, M. J., & Menten, K. M. 2002, IAU Symp., 206, 367 [NASA ADS] [Google Scholar]
- Bally, J., & Zinnecker, H. 2005, AJ, 129, 2281 [NASA ADS] [CrossRef] [Google Scholar]
- Banerjee, R., & Pudritz, R. E. 2007, ApJ, 660, 479 [NASA ADS] [CrossRef] [Google Scholar]
- Bieging, J. 1975, in Lect. Notes Phys., 42, 443 [Google Scholar]
- Bonnell, I. A., Vine, S. G., & Bate, M. R. 2004, MNRAS, 349, 735 [NASA ADS] [CrossRef] [Google Scholar]
- Campbell, M. F., Lester, D. F., Harvey, P. M., et al. 1989, ApJ, 345, 298 [NASA ADS] [CrossRef] [Google Scholar]
- Carpenter, J. M., & Sanders, D. B. 1998, AJ, 116, 1856 [NASA ADS] [CrossRef] [Google Scholar]
- Caswell, J. L., Vaile, R. A., Ellingsen, S. P., et al. 1995, MNRAS, 272, 96 [NASA ADS] [CrossRef] [Google Scholar]
- Curran, R. L., Chrysostomou, A., Collett, J. L., et al. 2004, A&A, 421, 195 [NASA ADS] [CrossRef] [EDP Sciences] [Google Scholar]
- De Buizer, J. M. 2006, ApJ, 642, L57 [NASA ADS] [CrossRef] [Google Scholar]
- De Buizer, J. M., Radomski, J. T., Telesco, C. M., et al. 2005, ApJS, 156, 179 [NASA ADS] [CrossRef] [Google Scholar]
- Dent, W. R. F., Little, L. T., Kaifu, N., et al. 1985, A&A, 146, 375 [NASA ADS] [Google Scholar]
- Eisner, J. A., Greenhill, L. J., Herrnstein, J. R., et al. 2002, ApJ, 569, 334 [NASA ADS] [CrossRef] [Google Scholar]
- Elitzur, M. 1992, Astronomical masers (Kluwer Academic Publishers), Astrophys. Space Sci. Lib., 170, 365 [Google Scholar]
- Erickson, E. F., & Tokunaga, A. T. 1980, ApJ, 238, 596 [NASA ADS] [CrossRef] [Google Scholar]
- Fish, V. L., & Reid, M. J. 2006, ApJS, 164, 99 [NASA ADS] [CrossRef] [Google Scholar]
- Fuller, G. A., Zijlstra, A. A., & Williams, S. J. 2001, ApJ, 555, L125 [NASA ADS] [CrossRef] [Google Scholar]
- Gaume, R. A., Johnston, K. J., & Wilson, T. L. 1993, ApJ, 417, 645 [NASA ADS] [CrossRef] [Google Scholar]
- Gibb, A. G., Hoare, M. G., Little, L. T., et al. 2003, MNRAS, 339, 1011 [NASA ADS] [CrossRef] [Google Scholar]
- Harvey-Smith, L., & Cohen, R. J. 2006, MNRAS, 371, 1550 [NASA ADS] [CrossRef] [Google Scholar]
- Hutawarakorn, B., & Cohen, R. J. 1999, MNRAS, 303, 845 [NASA ADS] [CrossRef] [Google Scholar]
- Kang, M., Bieging, J. H., Kulesa, C. A., et al. 2010, ApJS, 190, 58 [NASA ADS] [CrossRef] [Google Scholar]
- Keto, E., & Klaassen, P. 2008, ApJ, 678, L109 [NASA ADS] [CrossRef] [Google Scholar]
- Koch, P. M., Tang, Y.-W., & Ho, P. T. P. 2010, ApJ, 721, 815 [NASA ADS] [CrossRef] [Google Scholar]
- Kundu, M. R., & Velusamy, T. 1967, Ann. Astrophys., 30, 59 [NASA ADS] [Google Scholar]
- Lacy, J. H., Jaffe, D. T., Zhu, Q., et al. 2007, ApJ, 658, L45 [NASA ADS] [CrossRef] [Google Scholar]
- López-Sepulcre, A., Codella, C., Cesaroni, R., et al. 2009, A&A, 499, 811 [NASA ADS] [CrossRef] [EDP Sciences] [Google Scholar]
- Martí, J., Rodríguez, L. F., & Reipurth, B. 1993, ApJ, 416, 208 [NASA ADS] [CrossRef] [Google Scholar]
- Matsumoto, T., & Tomisaka, K. 2004, ApJ, 616, 266 [NASA ADS] [CrossRef] [Google Scholar]
- Matthews, N., Little, L. T., Nyman, L. A., et al. 1984, A&A, 136, 282 [NASA ADS] [Google Scholar]
- McKee, C. F., & Tan, J. C. 2003, ApJ, 585, 850 [NASA ADS] [CrossRef] [MathSciNet] [Google Scholar]
- Menten, K. M., Reid, M. J., Pratap, P., et al. 1992, ApJ, 401, L39 [NASA ADS] [CrossRef] [Google Scholar]
- Minier, V., Booth, R. S., & Conway, J. E. 2000, A&A, 362, 1093 [NASA ADS] [Google Scholar]
- Minier, V., Conway, J. E., & Booth, R. S. 2001, A&A, 369, 278 [NASA ADS] [CrossRef] [EDP Sciences] [Google Scholar]
- Moscadelli, L., Menten, K. M., Walmsley, C. M., et al. 1999, ApJ, 519, 244 [Google Scholar]
- Moscadelli, L., Xu, Y., & Chen, X. 2010, ApJ, 716, 1356 [NASA ADS] [CrossRef] [Google Scholar]
- Nedoluha, G. E., & Watson, W. D. 1992, ApJ, 384, 185 [NASA ADS] [CrossRef] [Google Scholar]
- Onello, J. S., Phillips, J. A., Benaglia, P., et al. 1994, ApJ, 426, 249 [NASA ADS] [CrossRef] [Google Scholar]
- Phillips, C., & van Langevelde, H. J. 2005, Ap&SS, 295, 225 [NASA ADS] [CrossRef] [Google Scholar]
- Roshi, D. A., Goss, W. M., Anantharamaiah, K. R., et al. 2005, ApJ, 626, 253 [NASA ADS] [CrossRef] [Google Scholar]
- Sato, M., Reid, M. J., Brunthaler, A., et al. 2010, ApJ, 720, 1055 [NASA ADS] [CrossRef] [Google Scholar]
- Schilizzi, R. T., Aldrich, W., Anderson, B., et al. 2001, Exp. Astron., 12, 49 [NASA ADS] [CrossRef] [Google Scholar]
- Scott, P. F. 1981, MNRAS, 194, 25 [NASA ADS] [Google Scholar]
- Sollins, P. K., Zhang, Q., & Ho, P. T. P. 2004, ApJ, 606, 943 [NASA ADS] [CrossRef] [Google Scholar]
- Sugiyama, K., Fujisawa, K., Doi, A., et al. 2008, PASJ, 60, 23 [NASA ADS] [Google Scholar]
- Sun, X. H., Reich, W., Waelkens, A., et al. 2008, A&A, 477, 573 [NASA ADS] [CrossRef] [EDP Sciences] [Google Scholar]
- Surcis, G., Vlemmings, W. H. T., Dodson, R., et al. 2009, A&A, 506, 757 [NASA ADS] [CrossRef] [EDP Sciences] [Google Scholar]
- Surcis, G., Vlemmings, W. H. T., Torres, R. M., et al. 2011a, A&A, 533, A47 [NASA ADS] [CrossRef] [EDP Sciences] [Google Scholar]
- Surcis, G., Vlemmings, W. H. T., Curiel, S., et al. 2011b, A&A, 527, A48 [NASA ADS] [CrossRef] [EDP Sciences] [Google Scholar]
- Tang, Y.-W., Ho, P. T. P., Koch, P. M., et al. 2009, ApJ, 700, 251 [NASA ADS] [CrossRef] [Google Scholar]
- Tang, Y.-W., Ho, P. T. P., Koch, P. M., et al. 2010, ApJ, 717, 1262 [NASA ADS] [CrossRef] [Google Scholar]
- Torstensson, K. J. E., van Langevelde, H. J., Vlemmings, W. H. T., et al. 2011, A&A, 526, A38 [NASA ADS] [CrossRef] [EDP Sciences] [Google Scholar]
- Vlemmings, W. H. T. 2008, A&A, 484, 773 [NASA ADS] [CrossRef] [EDP Sciences] [Google Scholar]
- Vlemmings, W. H. T., Harvey-Smith, L., & Cohen, R. J. 2006, MNRAS, 371, L26 [NASA ADS] [Google Scholar]
- Vlemmings, W. H. T., Surcis, G., Torstensson, K. J. E., et al. 2010, MNRAS, 404, 134 [NASA ADS] [Google Scholar]
- Vlemmings, W. H. T., Torres, R. M., & Dodson, R. 2011, A&A, 529, A95 [NASA ADS] [CrossRef] [EDP Sciences] [Google Scholar]
- Wardle, J. F. C., & Kronberg, P. P. 1974, ApJ, 194, 249 [NASA ADS] [CrossRef] [Google Scholar]
- Wood, D. O. S., & Churchwell, E. 1989, ApJS, 69, 831 [NASA ADS] [CrossRef] [Google Scholar]
- Wright, M. M., Gray, M. D., & Diamond, P. J. 2004, MNRAS, 250, 1272 [NASA ADS] [CrossRef] [Google Scholar]
- Xu, Y., Reid, M. J., Zheng, X. W., et al. 2006, Science, 311, 54 [NASA ADS] [CrossRef] [PubMed] [Google Scholar]
- Xu, Y., Reid, M. J., Menten, K. M., et al. 2009, ApJ, 693, 413 [NASA ADS] [CrossRef] [Google Scholar]
- Zapata, L. A., Ho, P. T. P., Schilke, P., et al. 2008, ApJ, 698, 1422 [Google Scholar]
- Zeilik II, M., & Lada, C. J. 1978, ApJ, 222, 896 [NASA ADS] [CrossRef] [Google Scholar]
- Zhang, Q., & Ho, P. T. P. 1997, ApJ, 488, 241 [NASA ADS] [CrossRef] [Google Scholar]
- Zhang, Q., Ho, P. T. P., & Ohashi, N. 1998, ApJ, 494, 636 [NASA ADS] [CrossRef] [Google Scholar]
- Zhang, B., Zheng, X. W., Reid, M. J., et al. 2009, ApJ, 693, 419 [NASA ADS] [CrossRef] [Google Scholar]
All Tables
All Figures
|
Fig. 1 Left panel: a view of the CH3OH maser features detected around W51–e2. Right panel: a zoom-in view of the boxed region of the left panel. The triangles symbols are the identified CH3OH maser features scaled logarithmically according to their peak flux density (Table 1). The maser LSR radial velocity is indicated by color. A 6 Jy beam-1 symbol is plotted for illustration in both panels. The linear polarization vectors, scaled logarithmically according to polarization fraction Pl, are overplotted. The two arrows indicate the direction of the bipolar outflow (PA ~ 150°; Keto & Klaassen 2008). The dashed line is the best linear fit of the CH3OH maser features in the right panel (PA = 57°). |
| In the text | |
|
Fig. 2 A close-up view of the CH3OH maser features detected around W51–IRS2. The triangles symbols are the identified CH3OH maser features scaled logarithmically according to their peak flux density (Table 2). The maser LSR radial velocity is indicated by color. A 1 Jy beam-1 symbol is plotted for illustration. The linear polarization vectors, scaled logarithmically according to polarization fraction Pl, are overplotted. |
| In the text | |
|
Fig. 3 A close-up view of the CH3OH maser features detected around W48 (G35.20–1.74). The triangles symbols are the identified maser features scaled logarithmically according to their peak flux density (Table 3). The maser LSR radial velocity is indicated by color. A 30 Jy beam-1 symbol is plotted for illustration. The linear polarization vectors, scaled logarithmically according to polarization fraction Pl, are overplotted. |
| In the text | |
|
Fig. 4 A close-up view of the CH3OH maser features detected around IRAS 18556+0138 (G35.20–0.74N). The triangles symbols are the identified CH3OH maser features scaled logarithmically according to their peak flux density (Table 4). The maser LSR radial velocity is indicated by color. A 6 Jy beam-1 symbol is plotted for illustration. The linear polarization vectors, scaled logarithmically according to polarization fraction Pl, are overplotted. The dashed line is the best linear fit of the CH3OH masers (PA = 140°). The two arrows indicate the direction, but not the origin, of the collimated CO-molecular bipolar outflow (PA = 58°; Gibb et al. 2003). |
| In the text | |
|
Fig. 5 Zoom-in view of the two CH3OH maser clusters of IRAS 18556+0138 (G35.20–0.74N). |
| In the text | |
|
Fig. 6 A complete view of the CH3OH maser features detected around W3(OH). The triangles symbols are the identified CH3OH maser features scaled logarithmically according to their peak flux density (Table 5). The maser LSR radial velocity is indicated by color. A 60 Jy beam-1 symbol is plotted for illustration. The linear polarization vectors, scaled logarithmically according to polarization fraction Pl, are overplotted. |
| In the text | |
|
Fig. 7 Zoom-in view of the six CH3OH maser groups of W3(OH). The dashed line in panel II is the best linear fit of the central CH3OH maser features (PA = 121°). A, B, and C are used to label three associations of 6.0-GHz OH, 12-GHz CH3OH, and 6.7-GHz CH3OH masers. |
| In the text | |
|
Fig. 8 The emerging brightness temperatures (TbΔΩ) as function of the linear polarization fraction (Pl). The blue and red circles indicate the unsaturated and saturated masers, respectively, detected in NGC 7538 (Surcis et al. 2011a), W51, W48, IRAS 18556+0138, and W3(OH). The red arrows indicate that the TbΔΩ values obtained from the radiative transfer method code are lower limits. The red full line is the limit of emerging brightness temperature above which the CH3OH masers are considered saturated (TbΔΩ > 2.6 × 10⁹ K sr; Surcis et al. 2011a), and the dotted line gives the lower limit to the linear polarization fraction for saturated masers (Pl ≈ 4.5%). |
| In the text | |
|
Fig. 9 The beaming angle (ΔΩ) as function of the brightness temperatures (Tb) for all the unsaturated CH3OH masers detected in NGC 7538 (Surcis et al. 2011a), W51, W48, IRAS 18556+0138, and W3(OH). The arrows indicate that the masers are unresolved, i.e. the maser angular size Σ is less than the beam-size of the observations and consequently ΔΩ is smaller and Tb is larger. The blue line is the best linear fit of the resolved masers and the dashed black line is the theoretical proportionality ΔΩ ∝ (Tb)-1 (Elitzur 1992). |
| In the text | |
|
Fig. 10 Left: modified version of Fig. 5a of Tang et al. (2009). The magnetic field (red segments) detected with the SMA (angular resolution |
| In the text | |
|
Fig. 11 Modified version of panel II of Fig. 7. The green segments, which are scaled logarithmically according to polarization fraction Pl, mark the direction of the magnetic field as derived from the linearly polarized emission of the CH3OH masers in the northern clump of W3(OH). |
| In the text | |
Current usage metrics show cumulative count of Article Views (full-text article views including HTML views, PDF and ePub downloads, according to the available data) and Abstracts Views on Vision4Press platform.
Data correspond to usage on the plateform after 2015. The current usage metrics is available 48-96 hours after online publication and is updated daily on week days.
Initial download of the metrics may take a while.