Fig. 10
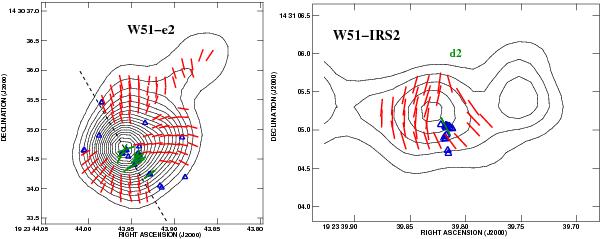
Left: modified version of Fig. 5a of Tang et al. (2009). The magnetic field (red segments) detected with the SMA (angular resolution  that at 5.4 kpc corresponds to ~ 4000 AU) is superimposed on the 870 μm continuum contour map of W51–e2. The dashed black line indicates the direction of the ionized accreting flow by Keto & Klaassen (2008). Right: the magnetic field (red segments) detected with the SMA is superimposed on the 870 μm continuum contour map of W51–e2 (Tang et al., priv. comm.). In both images the green segments, which are scaled logarithmically according to polarization fraction Pl, mark the direction of the magnetic fields as derived from the linearly polarized emission of the CH3OH masers (blue triangles; angular resolution
  corresponding to ~ 5 AU).
Current usage metrics show cumulative count of Article Views (full-text article views including HTML views, PDF and ePub downloads, according to the available data) and Abstracts Views on Vision4Press platform.
Data correspond to usage on the plateform after 2015. The current usage metrics is available 48-96 hours after online publication and is updated daily on week days.
Initial download of the metrics may take a while.