Fig. 1
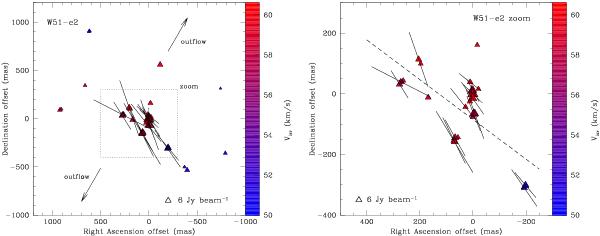
Left panel: a view of the CH3OH maser features detected around W51–e2. Right panel: a zoom-in view of the boxed region of the left panel. The triangles symbols are the identified CH3OH maser features scaled logarithmically according to their peak flux density (Table 1). The maser LSR radial velocity is indicated by color. A 6 Jy beam-1 symbol is plotted for illustration in both panels. The linear polarization vectors, scaled logarithmically according to polarization fraction Pl, are overplotted. The two arrows indicate the direction of the bipolar outflow (PA ~ 150°; Keto & Klaassen 2008). The dashed line is the best linear fit of the CH3OH maser features in the right panel (PA = 57°).
Current usage metrics show cumulative count of Article Views (full-text article views including HTML views, PDF and ePub downloads, according to the available data) and Abstracts Views on Vision4Press platform.
Data correspond to usage on the plateform after 2015. The current usage metrics is available 48-96 hours after online publication and is updated daily on week days.
Initial download of the metrics may take a while.