| Issue |
A&A
Volume 540, April 2012
|
|
|---|---|---|
| Article Number | A103 | |
| Number of page(s) | 16 | |
| Section | Extragalactic astronomy | |
| DOI | https://doi.org/10.1051/0004-6361/201118396 | |
| Published online | 04 April 2012 | |
Bar pattern speed evolution over the last 7 Gyr⋆,⋆⋆
1 Dpto. de Física Teórica y del Cosmos, University of Granada, Facultad de Ciencias (Edificio Mecenas), 18071 Granada, Spain
e-mail: isa@ugr.es
2 Instituto Carlos I de Física Teórica y Computación
3 Instituto de Astrofísica de Canarias, C/ Vía Láctea s/n, 38200 La Laguna, Spain
e-mail: [jalfonso;jairo]@iac.es
4 Departamento de Astrofísica, Universidad de La Laguna, C/ Astrofísico Francisco Sánchez, 38205 La Laguna, Spain
Received: 3 November 2011
Accepted: 3 February 2012
Context. The tumbling pattern of a bar is the main parameter characterising its dynamics. From numerical simulations, its evolution since bar formation is tightly linked to the dark halo in which the bar is formed through dynamical friction and angular momentum exchange. Observational measurements of the bar pattern speed with redshift can restrict models of galaxy formation and bar evolution.
Aims. We aim to determine for the first time the bar pattern speed evolution with redshift based on morphological measurements.
Methods. We have selected a sample of 44 low-inclination ringed galaxies from the SDSS and COSMOS surveys covering the redshift range 0 < z < 0.8 to investigate the evolution of the bar pattern speed. We derived morphological ratios between the deprojected outer ring radius (Rring) and the bar size (Rbar). This quantity is related to the parameter ℛ = RCR/Rbar used for classifiying bars in slow and fast rotators, and allows us to investigate possible differences with redshift.
Results. We obtain a similar distribution of R at all redshifts. We do not find any systematic effect that could be forcing this result.
Conclusions. The results obtained here are compatible with the main bulk of the bar population (~70%) being fast-rotators and with no evolution of the pattern speed with redshift. We argue that if bars are long-lasting structures, the results presented here imply that there has not been a substantial angular momentum exchange between the bar and halo, as predicted by numerical simulations. In consequence, this might imply that the discs of these high surface-brightness galaxies are maximal.
Key words: galaxies: high-redshift / galaxies: evolution / galaxies: structure / galaxies: kinematics and dynamics
The appendix is available in electronic form at http://www.aanda.org
© ESO, 2012
1. Introduction
Stellar bars are thought to be the main internal mechanism driving the dynamical and secular evolution of disc galaxies. They are able to modify the central structure and morphology of galaxies, mostly because they are responsible for a substantial redistribution of mass and angular momentum in the discs (e.g., Sellwood 1981; Sellwood & Wilkinson 1993; Pfenniger & Friedli 1991; Athanassoula 2003; Debattista et al. 2006). In the last decade, numerical simulations have addressed the importance of the transference of angular momentum between baryonic and dark matter components (e.g., Debattista & Sellwood 1998, 2000). The amount of angular momentum exchanged is related to the specific properties of the galaxies, such as the bar mass, halo density, and halo velocity dispersion (Debattista & Sellwood 1998; Athanassoula 2003; Sellwood & Debattista 2006) and it takes place mainly at the disc resonances (Athanassoula 2003; Martinez-Valpuesta et al. 2006). Recent works have shown that gas fraction can also play an important role in the bar-halo interplay and therefore in the bar evolution (Bournaud & Combes 2002; Romano-Díaz et al. 2009; Villa-Vargas et al. 2010). Moreover, bars are efficient at funneling material towards the galaxy centre and possibly they influence the building of the stellar bulge (e.g., Kormendy & Kennicutt 2004) and the central black hole (e.g., Shlosman et al. 1989; Regan & Mulchaey 1999; Corsini et al. 2003). Peanut/boxy bulges in galaxies are also thought to be associated with bending instabilities and bar vertical resonances (Bureau & Freeman 1999; Debattista et al. 2004, 2006; Athanassoula 2005; Martinez-Valpuesta et al. 2006; Méndez-Abreu et al. 2008).
As already mentioned, the bar formation and destruction rate as well as the morphological and dynamical changes suffered by the discs during their lifetime are strongly affected by the angular momentum exchange. Therefore, the cosmological evolution of the bar fraction can also depend on this effect. Observations show that bars in low-redshift galaxies are ubiquitous, with a fraction of ~45% at visual wavelengths (e.g., Marinova & Jogee 2007; Reese et al. 2007; Barazza et al. 2008; Aguerri et al. 2009; Masters et al. 2011) that rises to ~70% in the near-infrared (Knapen et al. 2000; Eskridge et al. 2000; Menéndez-Delmestre et al. 2007). The bar fraction depends on morphological type, being lower in lenticular galaxies than in spirals (Marinova & Jogee 2007; Aguerri et al. 2009; Nair & Abraham 2010; Barway et al. 2011; but see also Masters et al. 2011). Some recent results show that bar fraction is a strong function of galaxy mass (Méndez-Abreu et al. 2010; Nair & Abraham 2010) and colour (Hoyle et al. 2011). In contrast, bar fraction is only barely affected by the environment (Aguerri et al. 2009; Li et al. 2009; Méndez-Abreu et al. 2010).
The evolution of the bar fraction with redshift is still a matter of debate. Abraham et al. (1999) found that the fraction of barred galaxies at z > 0.5 is lower than the local fraction. However, other authors claim that this may be the consequence of selection effects, due to the high angular resolution needed to find bars (Elmegreen et al. 2004; but see van den Bergh 2002). To deal with the angular resolution problem, several studies have carried out this analysis using the Advanced Camera for Surveys (ACS) on the Hubble Space Telescope (HST). Thus, Elmegreen et al. (2004) and Jogee et al. (2004) found the same bar fraction (~40%) at redshift z = 1.1 as in the local Universe, suggesting that the bar dissolution cannot be common during a Hubble time unless the bar formation rate is comparable to the bar destruction rate. In contrast, Sheth et al. (2008), in a recent study using images from the Cosmological Evolution Survey (COSMOS; Scoville et al. 2007) and using a larger sample than previous studies, found that the bar fraction at z = 0.84 is one-third of the present-day value. They also found a much stronger evolution for low-mass galaxies and late-type morphological types. Part of the differences may be due to the selection effects and other systematic effects that still need to be investigated in more detail.
In any case, these results show that bars have been common structural components of the discs of galaxies during the last 8 Gyr. The study of their origin and evolution could be crucial for understanding the galaxy evolution since z = 1. This study can be made by analysing three parameters that characterise the bars: length, strength and pattern speed. Several methods and techniques have been proposed to measure these bar parameters. The bar length has been obtained directly by visual inspection on galaxy images (Kormendy 1979; Martin 1995; Méndez-Abreu et al. 2010; Nair & Abraham 2010; Masters et al. 2011), searching for the maximum ellipticity of the galaxy isophotes (Wozniak et al. 1995; Laine et al. 2002; Marinova & Jogee 2007; Aguerri et al. 2009), locating variations of the isophotal position angle (Sheth et al. 2003; Erwin 2005), analysing Fourier moments (Quillen et al. 1994; Aguerri et al. 2000a, 2003), or by photometric decomposition of the surface-brightness profiles of galaxies (Prieto et al. 1997, 2001; Aguerri et al. 2005; Laurikainen et al. 2005; Gadotti 2008; Weinzirl et al. 2009; Gadotti 2011). The resulting studies reported that the typical bar length is about 3–4 kpc, and strongly correlates with the disc scale-length (Aguerri et al. 2005; Pérez et al. 2005; Erwin 2005; Marinova & Jogee 2007; Laurikainen et al. 2007). Bar length is also a function of galaxy size, morphology and colour (Aguerri et al. 2009; Hoyle et al. 2011).
The bar strength has been determined by measuring bar torques (Buta & Block 2001), isophotal ellipticity (Martinet & Friedli 1997; Aguerri 1999; Whyte et al. 2002; Marinova & Jogee 2007), or Fourier modes (Ohta et al. 1990; Aguerri et al. 2000a; Laurikainen et al. 2005; Athanassoula & Misiriotis 2002). This parameter depends on galaxy morphology. Bars in lenticular galaxies are generally weaker than in spirals (Das et al. 2003; Laurikainen et al. 2007; Barazza et al. 2008; Aguerri et al. 2009; Buta et al. 2010).
The bar pattern speed, Ωb, is the main kinematic observable and describes the dynamics of the bar. This tumbling pattern determines the position of the resonances in the disc and it is most usefully parametrised by a distance-independent parameter ℛ = RCR/Rbar, where RCR is the Lagrangian/corotation radius, where the gravitational and centrifugal forces cancel out in the rest frame of the bar, and Rbar is the bar semi-major axis. Therefore, bars that end near corotation (1 < ℛ < 1.4) are considered to be fast, while shorter bars (ℛ > 1.4) are commonly called slow. If ℛ < 1.0, orbits are elongated perpendicular to the bar, and self-consistent bars cannot exist in this regime (Contopoulos 1980). The most reliable method for obtaining the location of corotation was that proposed by Tremaine & Weinberg (1984, hereafter TW method), which uses a set of simple kinematic measurements to derive the bar pattern speed assuming that the tracer obeys the continuity equation, that the discs are flat, and that there is one well-defined pattern speed. However, long integration times are required in medium-size telescopes to reach the high signal-to-noise ratio required to apply the TW method. This limits its application to a small number of candidates. Despite the difficulties in obtaining bar pattern speeds, a reasonable number of nearby galaxies have been investigated (Merrifield & Kuijken 1995; Debattista et al. 2002; Aguerri et al. 2003; Corsini et al. 2007; Corsini 2011), finding that all bars end near corotation. Some of these assumptions are not applicable for galaxies with nested bars, and there is now a simple extension of the TW method to multiple pattern speeds (Maciejewski 2006; Corsini et al. 2003; Meidt et al. 2009), and the fact that some authors have shown that the TW method can be applied to CO (Rand & Wallin 2004; Zimmer et al. 2004) and Hα velocity fields (Hernandez et al. 2005; Emsellem et al. 2006; Fathi et al. 2007; Chemin & Hernandez 2009; Gabbasov et al. 2009; Fathi et al. 2009) opens a new window to these studies.
Some indirect ways to derive the bar pattern speed include methods based on numerical modelling: generating either self-consistent models or models using potentials derived from the light distributions (Duval & Athanassoula 1983; Lindblad et al. 1996; Laine et al. 1998; Weiner et al. 2001; Pérez et al. 2004; Zánmar Sánchez et al. 2008) and then matching numerical experiments with the observed velocity fields; or by matching numerical simulations to the galaxy morphology (Hunter et al. 1988; England 1989; Laine et al. 1998; Aguerri et al. 2001; Rautiainen et al. 2005). Other indirect methods to derive the bar pattern speed include identifying morphological or kinematic features with resonances: using a variety of features (Elmegreen & Elmegreen 1990); the shape of dust lanes (Athanassoula 1992); the sign inversion of the radial streaming motion across corotation (Canzian 1993); rings as resonance indicators (Buta 1986; Buta et al. 1995); phase-shift between the potential and density wave patterns (Zhang & Buta 2007); location of minimum of star formation (Cepa & Beckman 1990; Aguerri et al. 2000a); or comparison of the behaviour of the phase Fourier angle in blue and near-infrared images (Puerari & Dottori 1997; Aguerri et al. 1998). Although possibly the most accurate indirect method to calculate pattern speeds is the the comparison of gas velocities to those obtained in numerical simulations that use a potential obtained from optical or near-infrared light, it is also very time-consuming and can only be applied to a relatively small number of objects.
The technique to determine the bar pattern speed based on connecting the location of rings to orbital resonances was introduced by Buta (1986). It is based on the theoretical work presented by Schwarz in a series of papers (Schwarz 1981, 1984b,a), showing how these ring structures appear near the dynamical Lindblad resonances due to a bar-like perturbation. To directly apply this method to find the specific value of the pattern speed, not only the location of the ring and the association to a resonance is required, but some kinematic information is also needed. However, we can use the ℛ parametrisation of the bar introduced previously, and determine the ratio between the outer ring radius (linked to the outer Lindblad resonance, OLR) and the bar length. In this way, we can indirectly determine, not the pattern speed, but whether the bars measured are in the slow or fast regime.
The bar parameters discussed above have been analysed in local galaxy samples. There are no previous studies in the literature about the evolution of the length, strength and pattern speed of bars. In this article, we study for the first time the dynamical evolution of bars with redshift, going from the local Universe to z ~ 0.8. We use a well-selected sample of barred galaxies with outer rings to exploit the power of this method. The study of the dynamical evolution of bars is critical to constrain the angular momentum exchange between the disc and the halo and their subsequent evolution. Weinberg (1985) predicted that a bar would lose angular momentum due to a massive dark matter halo through dynamical friction, slowing down in the process. This prediction was additionally confirmed in numerical simulations (Debattista & Sellwood 1998, 2000; Athanassoula 2003; Sellwood & Debattista 2006) where it was found that bars are slowed efficiently if a substantial density of dark matter is present in the region of the bar. On the other hand, if the mass distribution is dominated by the stellar disc, then the bar remains rapidly rotating for a long time. We show in this work that bars did not show a systematic change in their dynamical state in the last ~7 Gyr.
The article is organised as follows: we present the sample selection and morphology discussion in Sect. 2. We describe the method followed to measure the ring and bar radius in Sect. 3. The results are presented in Sect. 4 and we discuss their implications in Sect. 5. Conclusions are provided in Sect. 6. Throughout the paper the cosmological parameters used are H0 = 70 km s-1 Mpc-1, ΩΛ = 0.7, and Ωm = 0.3.
2. Sample selection
The galaxy samples studied in this article were extracted from two different surveys: low-redshift galaxies were taken from the Sloan Digital Sky Survey (SDSS; 0.01 < z < 0.04), and high-redshift galaxies were selected from COSMOS (0.125 < z < 0.75).
Two caveats must be discussed before the samples are described in detail: first, it is worth noticing that the galaxy samples are not meant to be complete in any sense, however, the selection criteria make the two samples fully comparable. Second, in Aguerri et al. (2009) we studied how the resolution of the SDSS images can affect our detection of bars. We worked out, using artificial galaxies, that the shortest bars that we are able to resolve have a length of ~9 pixels. Considering a mean PSF in our SDSS images with a FWHM of 1 09 (2.77 pixel), we conclude that we resolve bars larger than ~3 × FWHM, or equivalently, ~0.5 kpc at z = 0.01 and ~2 kpc at z = 0.04. The COSMOS sample was selected using the ACS data in the F814W filter. The images were processed to a resolution of 005 pixel-1 with an averaged PSF FWHM of 0097 (Scoville et al. 2007; Koekemoer et al. 2007). Based on the previous considerations, we will resolve bars larger than ~3 × FWHM which corresponds to ~0.6 kpc at z = 0.125 and ~2.2 kpc at z = 0.75, an perfectly matches the SDSS spatial resolution in the low-redshift range.
2.1. Outer ring morphological classification
The ring morphological classification used in this study is based on the work of Buta & Crocker (1991). They divided the outer rings into three main morphological classes resembling the rings developed in numerical simulations near the OLR (Schwarz 1981). The first class, called R , is characterised by a 180° winding of the spiral arms with respect to the ends of a bar. The second type is known as an R
 ring. It is defined by a 270° winding of the outer arms with respect to the bar ends, so that in two opposing quadrants the arm pattern is doubled. The R and R morphologies were predicted by Schwarz (1981) as the kind of patterns that would be expected near the OLR in a barred galaxy. The third class is referred to in Buta & Crocker (1991) as the R1R morphology, where the outer arms break not from the ends of the bar, but from an R-type ring. The existence of this combined type, which may be linked to the population of both main families of OLR periodic orbits (Schwarz 1981), provides some of the clearest evidence of the OLR in barred galaxy morphology. Some examples of this classification, taken from our sample of low- and high-redshift galaxies, are shown in Fig. 1. Buta et al. (1995) derived the distribution of intrinsic axis ratios for the outer rings using the Catalog of Southern Ringed Galaxies. They found that outer rings present in barred galaxies are intrinsically elliptical with an axis ratio ~ 0.82 ± 0.07, and that the intrinsic ellipticity varies from the R (~0.74 ± 0.08) to the R (~0.87 ± 0.08). The intrinsic shape of the rings plays an important role when deprojecting distances such as the bar length and the ring radius, thus, more intrinsically elliptical rings will increase the uncertainties in the measurements. We decided to remove the R type of rings from our samples, and keep only the R types since they are intrinsically rounder. In fact, their intrinsic shape is very similar to that of typical discs (Fasano et al. 1993; Ryden 2004).
2.2. Low redshift
The barred ringed galaxies at low redshift were obtained from the galaxy sample analysed in Aguerri et al. (2009). These authors selected a volume limited sample of galaxies from the spectroscopic catalogue of the SDSS Data Release 5 (SDSS-DR5, Adelman-McCarthy et al. 2007). This sample covers the redshift range 0.01 < z < 0.04, down to an absolute magnitude of Mr < −20, and with low inclination i < 60°. The full sample consists of 3060 galaxies with a morphological mix of 26% ellipticals, 29% lenticulars, 20% early-type spirals, and 25% late-type spirals. Galaxies were classified into barred and unbarred systems by searching for absolute maxima in the ellipticity radial profiles of their isophotes (see Aguerri et al. 2009, for details). From the barred sample we visually inspected the SDSS galaxy images to look for the presence of outer rings of type R.
We obtained a total of 18 barred galaxies with suitable outer ring features. Table 1 shows the main properties of the bars and ring features measured in these galaxies.
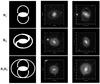 |
Fig. 1 Left column: schematic view of the different ring types in barred galaxies (see Sect. 2.1). Ring type examples of barred galaxies at high- (middle column), and low- (right column) redshifts. |
2.3. High redshift
As for the low-redshift sample, we have chosen a number of low-inclination galaxies from the third release of the COSMOS HST survey (Scoville et al. 2007). We first downloaded all the 81 image tiles from the COSMOS/ACS fields, observed using the F814W (I-band) filter, from the Multimission Archive at STScI (MAST) for visual inspection. These observations cover ~2 deg2 with a pixel scale (for the drizzled data) of 005 pixel-1.
We visually scanned the COSMOS fields to look for clearly ringed barred galaxies. After a preliminary list was created, we correlated the positions with the spectroscopic redshifts from the Very Large Telescope (VLT) and Magellan COSMOS spectroscopic surveys (zCOSMOS Survey; Lilly et al. 2007) to search for candidates with reliable redshifts. We also searched for photometric redshifts for the remaining candidates. We used photometric redshifts determined by Faure et al. (2008) using the Le Phare photometric redshift estimation code (Ilbert et al. 2006), details concerning the multi-wavelength photometry can be found in Mobasher et al. (2007). Faure et al. (2008) used 1095 spectroscopic redshifts from the zCOSMOS Survey (Lilly et al. 2006) to calibrate the ground-based photometric zero points. Using eight bands, this method achieves a photometric redshift accuracy of σΔz/(1 + zs) = 0.031.
From this sample, only galaxies showing type R ring were included in the sample. Finally, the high-redshift sample consists of 26 galaxies. The main properties of the bars and ring features are shown in Table 2. The sample covers the redshift range 0.125 < z < 0.75. Figure 2 shows the redshift distribution.
General properties of the SDSS sample.
General properties of the COSMOS sample.
3. Outer ring radius and bar size definition
Our approach to quantifying the dynamical state of the bars in our sample of ringed galaxies is based on the measurements of both the bar and ring radius. We deprojected bar size in the plane of the galaxy using i, the galaxy inclination, and θ, the position angle of the galaxy component (bar or ring). We assumed that the outer ring reflects the properties of the disc, and therefore that the ellipticity and position angle of the ring and disc are the same. In Sect. 2.1 we have discussed that both components are intrinsically similar and possible differences will only affect our results by introducing a large scatter. Under this hypothesis, the ring radius does not need to be deprojected, since it is measured along the major axis of the galaxy, and the galaxy inclination can be derived simply by i = arccos(1 − ϵring).
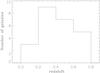 |
Fig. 2 Redshift distribution for the high-redshift sample. |
3.1. Ellipse fitting
The low-redshift sample measurements were derived by using the ellipticity and position angle radial profiles extracted from the symmetrised images. This approach allows us to clean the images from spurious sources. It works as follows: each image is rotated 180° with respect to the galaxy centre. Then, we subtract the rotated frame from the original one. The residual image was sigma-clipped to identify all the pixels with a number of counts lower than 1σ, where σ is the rms of the image background. The value of the deviant pixels was set to zero. Finally, the cleaned image was subtracted from the original one to obtain the symmetrised image. The ellipses were then fitted to the isophotes of the symmetrised images of the galaxies using the IRAF1 task ELLIPSE (Jedrzejewski 1987). We used an iterative wrapped procedure that runs the ellipse fitting several times, changing the trial values at each fit iteration, until a good fit at all radii is obtained. At each fixed semi-major axis length, the coordinates of the centre of the fitting ellipse were kept fixed. This centre was identified with the position of the central intensity peak. The trial values for the ellipticity and position angle were randomly chosen between 0 and 1 and between −90° and 90°, respectively. The fitting procedure stopped either when convergence was reached or after 100 iterations.
The high-redshift sample ellipticity and position angle profiles were derived using the same wrapping procedure to maximise the goodness of the ellipse fitting. However, in this case we preferred not to symmetrise the images but applied a 2 × 2 pixel box smoothing. The image symmetrisation was not needed since the sample galaxies were not contaminated by other sources within their projected surface and the smoothing provided better radial profiles by improving the signal-to-noise ratio of the images.
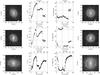 |
Fig. 3 Three examples of the ringed galaxies selected from the SDSS data. From left to right: original r-band SDSS image, ellipticity isophotal radial profile, position angle radial profile of the isophotes, and deprojected image. The vertical full, dashed and dotted-dashed lines represent the Rbar − min, Rbar − max, and Rring, respectively. The horizontal full, dashed and dotted-dashed lines show the PA of the bar, ellipticity of the disc and PA of the disc, respectively. The circle represented in the right-most panels has a radius equal to the measured radius of the ring. |
3.2. Bar length
The ellipticity radial profile of a typical barred galaxy reaches a minimum at the centre, because of either seeing effects or a spherical bulge. Then, it usually shows a general increase to a local maximum, and then suddenly decreases towards a minimum at the location where the isophotes become axisymmetric in the face-on case. The position angle profile is also characteristic in barred galaxies, being constant in the bar region and then changing to fit the outer disc orientation (e.g., Wozniak et al. 1995; Aguerri et al. 2000b). These characteristic profiles are produced by the shape and orientation of the stellar orbits of the bar (see Contopoulos & Grosbol 1989; Athanassoula 1992). Different methods have been used to measure the bar length based on the ellipticity and position angle radial profiles (see Athanassoula 2002; Michel-Dansac & Wozniak 2006). However, the solution is always ambiguous and it can lead to misleading results. To remove these uncertainties we decided to measure the bar length as the midpoint between the radius of the maximum and minimum ellipticity. These two different measurements of the bar length represent the extreme cases (Michel-Dansac & Wozniak 2006) and therefore they represent an upper limit of our errors in the bar radius measurements. We preferred this solution not to bias our conclusions. The position angle of the bar, which is needed to deproject the bar length, was measured at the position of the maximum ellipticity, so we avoided problems related to position angle variation in the bar-disc region. An example of this method applied to three of our low- and high-redshift galaxies is shown in Figs. 3, 4, respectively.
3.3. Ring radius
As for the bar component, the ring radius was derived based on the ellipticity and position angle radial profiles. In the ring region, we expect that the ellipticity and position angle radial profiles will remain constant because of the stellar orbits in the ring. Therefore, we identify the region of the profile where the ring is present and we measured the ring radius as the position where the ellipticity and position angle become constants. The ring ellipticity and position angle also needed for deprojecting were derived as a mean of these constant values. The error in the ring radius was calculated by comparing the estimated ring radius with the radius at which the ellipticity varies by more than three times the standard deviation of the disc ellipticity. Figures A.1 and A.2 show all galaxies with the ring radius overplotted.
4. Results
Tables 1 and 2 show the obtained parameters for the ring radius, ellipticity, position angle and the bar semi-major axis, as derived in Sect. 3.1. Most galaxy inclinations lie below i < 40°. The bar size range, using the maximum ellipticity, covers 2.5 to 6.3 kpc. Most of the bars in the local Universe (about 70%, see Aguerri et al. 2009) are within this bar size range. Similar values of the bar size range are found for our high-redshift galaxies. The mean bar radius of our low- and high-redshift galaxies are 4.5 ± 1.04 and 3.5 ± 1.33 kpc, respectively. This means that within the errors both galaxy samples have similar bars according to their lengths and they are similar also to local samples of barred galaxies (see Aguerri et al. 2009). The average bar size, using the minimum ellipticity, for our low- and high-redshift galaxies are also similar: 5.9 ± 1.43 and 5.3 ± 1.70 kpc, respectively. Thus, both samples of galaxies show similar bar sizes independent of the method used for determining the bar length. It has been argued (Michel-Dansac & Wozniak 2006) that the sizes calculated using the minimum of the ellipticity correlate well with the position of corotation, giving a more physically significant size than measurements obtained with the maximum of the ellipticity, which clearly underestimates the true bar size. To avoid problems related to the bar size calculation, as explained in Sect. 3.2, we have opted for using the mid-point and to take into account the values of Rbar using both methods to obtain the errors.
We determined the strength of the bars for the low- and high-redshift galaxies by using the maximum ellipticity of the bar (see Aguerri et al. 2009). Both samples cover the same range of bar strengths. Thus, the mean values of the bar strength of our low- and high-redshift samples are 0.20 ± 0.07, and 0.17 ± 0.05. These values are similar to the mean strength of bars in the local Universe (0.20 ± 0.07; see Aguerri et al. 2009). We can conclude that according to the size and strength of the bars, our low- and high-redshift galaxy samples have similar bars as those found in a complete local sample of barred galaxies (see Aguerri et al. 2009).
To determine whether our galaxies are in the fast or slow range (see Sect. 1), we defined the ratio ℛring = Rring/Rbar, where Rring is the ring radius and Rbar, is the bar semi-major axis, as characterised in Sect. 3. Because we cover this ratio for galaxies with redshifts between 0 < z < 0.8, we can study possible changes of this ratio with redshift. Figure 5 shows the distribution of ring radii (Rring) vs. the bar semi-major axis (Rbar) for the whole sample. We considered a fast bar to be those bars for which the RCR/Rbar ratio lies between 1.0 and 1.4. This ratio is plotted in Fig. 5 for both values and is calculated using linear resonance theory and a flat rotation curve (Athanassoula et al. 1982). In this case the position of the OLR (i.e., the ring radius) and the CR are related in the following way: 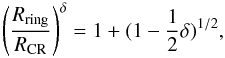 (1)where δ lies between 0.7 and 1.0 for early-type discs, see Athanassoula et al. (1982). We assumed δ = 1.0 in Fig. 5 for simplicity, but this choice does not alter the results. It is clear from Fig. 5 that all galaxies, independent of their redshift bin, fall into the fast-bar category.
We have investigated the influence of the inclination of the galaxies on this result. The average values for ℛring at different inclinations are the following: i) for the low-redshift sample and b/a > 0.9, the average ℛring = 0.51 ± 0.06, for b/a < 0.9, the average ℛring = 0.50 ± 0.08; ii) for the high-redshift sample; for b/a > 0.9, the average ℛring = 0.55 ± 0.09 and for b/a < 0.9, the average ℛring = 0.52 ± 0.12. All the values are comparable independently of redshift and inclination; and therefore, we do not see changes of this ratio with redshift.
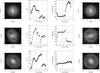 |
Fig. 4 Three examples of the ringed galaxies selected from the COSMOS data. From left to right: original r-band COSMOS image, ellipticity isophotal radial profile, position angle radial profile of the isophotes, and deprojected image. The vertical full, dashed and dotted-dashed lines represent the Rbar − min, Rbar − max, and Rring, respectively. The horizontal full, dashed and dotted-dashed lines show the PA of the bar, ellipticity of the disc and PA of the disc, respectively. The circle represented in the right-most panels has a radius equal to the measured radius of the ring. |
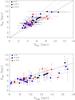 |
Fig. 5 Top panel: bar semi-major axis vs. corotation radius for the high- and low-redshift sample. The sample was divided into three redshift bins; z ≈ 0 (solid black circles), z < 0.5 (solid blue squares), and z > 0.5 (solid red stars). The solid, dotted and dashed lines represent the values, from linear theory, of ℛ = RCR/Rbar = 1.0,1.2 and 1.4, respectively. This range corresponds to what is considered in the literature as fast bars (see Sect. 1). Bottom panel: outer ring radius vs. bar semi-major axes radius for the high- and low-redshift sample, the symbols and lines are the same as those represented in the top panel. Notice that all galaxies, regardless of their redshift, clearly fall into the “fast-bar” region. |
5. Discussion
5.1. Possible caveats
The tightness of the results shown in Fig. 5 is somewhat unexpected considering the intrinsic uncertainties inherent to the measurements used in this work. For instance, we have assumed that the outer rings are perfectly circular, which is critical for the deprojection of the ring and bar lengths. In Sect. 3 we justified the assumption of roundness for the R and R1R ring morphologies. In addition, we have taken into account the limits of intrinsic axis ratios given in Buta et al. (1995) to calculate the errors in the projected sizes, and we have demonstrated in the previous section that our result does not depend on the inclination of the galaxies. Therefore we conclude that projection effects are not biasing our results.
Another possible caveat to our result might be that the choice of ring galaxies biases the sample towards a certain pattern speed domain. However, numerical simulations (Byrd et al. 1994) have shown that resonant outer rings can be present in both fast and slow bars. All types of ring morphologies are found at different pattern speeds. Byrd and collaborators also found that all types of ring morphologies also developed for different bar strengths. Athanassoula et al. (2010), who presented a new theory for ring and spiral formation, argued that there is a connection between the bar strength and the morphology of the rings. Nevertheless, R rings, as those selected in this work, are located in barred galaxies with similar bar strengths as our galaxies (see Athanassoula et al. 2010). In addition, these authors showed that R type rings can be formed in galaxies with fast and slow bars.
Although the bar size as measured in different rest-frame band passes could be different, it has recently been shown (Gadotti 2011) that in fact the difference in bar size is negligible and therefore we are not introducing a bias by measuring the bars a high-redshift near the g-band rest-frame while the low-redshift bar sizes are measured from the SDSS r-band.
Our low- and high-redshift samples are by no means complete. Therefore, it is customary to investigate whether this is affecting the results presented in Fig. 5. Since our low- and high-redshift barred galaxies are similar in size and strength we could be biasing the resulting pattern speeds towards a particular regime. In other words, that we have not observed evolution in the pattern speed could be just caused by the selection of similar fast bars. However, we know from a study of a complete sample of local barred galaxies (Aguerri et al. 2009) that only 30% of the local bars show longer lengths than our ringed barred galaxies. Studies of high-redshift bars, 0.4 < z < 0.8, (Jogee et al. 2004; Barazza et al. 2009) have shown that the bar size distribution is similar to that of local galaxies and therefore, as discussed before, similar to the bar size range of the bars presented in this work. Therefore, we do not seem to be looking at any special type of bar by analysing ringed galaxies. As previously mentioned, numerical models show that bars become longer and slower as they age. We can accordingly set a 30% upper limit to the bars that could have suffered a change in their pattern speed in the last 7 Gyr, assuming that nearby long bars are the end-products of the evolution of fast bars. The remaining 70% of bars did not substantially lose angular momentum to the halo, maintaining their pattern speed. This discussion might be related to an implicit morphological bias, since it remains, even for local galaxies, to derive the pattern speed of bars in very late-type gaseous rich spirals, which might suffer an intrinsically different evolution (e.g., Bournaud & Combes 2002).
5.2. Comparison with the results from numerical modelling
The recent numerical work of Villa-Vargas et al. (2010) showed that the evolution of the pattern speed and bar-growth of a bar embedded in a live dark matter halo strongly depends on the gas content. In their simulations, a fixed fraction of the total mass was converted into gas mass, and the evolution of the bar parameters was then followed in time. The presence of gas changes the evolution of both the bar growth and the pattern speed evolution, the addition of gas can stop, or even speed up, the pattern speed of the bar with time. The bar size is anti-correlated with the disc gas fractions. These gas-rich galaxies would be related to early-type galaxies because the gas leads to a higher central mass concentration and therefore larger bulges. The results we present in this paper could agree with these gas-rich models. However, the full picture is still unclear because it is observed that longer bars reside in late-type galaxies (e.g., Erwin 2005), which is against the model predictions. Furthermore, we would need to explain why all galaxies should have started with similar gas fractions in their discs.
There is also the possibility that the bars that we see at z ~ 0.8 do not survive till the present and therefore, we do not see evolution because the time-scales involved in the formation and destruction are too short. It has been discussed (see Pfenniger & Norman 1990; Bournaud & Combes 2002; Bournaud et al. 2005) that gas-rich bars, i.e., late-type spirals, are short-lived, with lifetimes of 1–2 Gyr. This short time scale would mimic a lack of evolution of long-lived bars; however, the galaxies in the sample show morphologies typical of early-type spirals and there is evidence, from stellar population studies (Pérez et al. 2009; Sánchez-Blázquez et al. 2011), that bars in early type galaxies are long-lived. If this is the case, and most of the ring galaxies we observe present long-lasting bars, it would imply that bars cannot have grown in time and remained in the fast-speed regime without significantly increasing in size. Therefore, the fact that we see the ring radius and the bar size covering the same size range at all redshifts, and moreover large bars at high-redshift, implies that bars do not grow significantly in size with time.
The result shown in Fig. 5 implies that bars have not evolved considerably, neither in size nor in pattern speed, since around the time when the Universe was half its present age. Most numerical simulations obtain bars that evolve with time, getting longer and stronger while slowing down (e.g., Debattista & Sellwood 1998; Athanassoula 2003). This effect is mostly caused by the angular momentum exchange of the bar-disc system with the dark matter halo. Thus, the fact that bars are compatible with fast rotators at all redshifts indicates that the angular momentum exchange between the bar and halo has not been significant enough in the last 7 Gyr to slow the bars down. If the pattern speed can be used to set constraints to the halo-to-disc mass ratio, these results might imply that the discs in the high surface-brightness galaxies of our sample are maximal.
6. Summary and conclusions
We have analysed 44 low-inclination ringed galaxies spanning a redshift range between 0 < z < 0.8 to study the possible evolution of the pattern speed in the last 7 Gyr.
We calculated for each galaxy a morphological parameter indicative of the dynamical state of their bars. In particular, we derived whether they are fast or slow rotators. We found that the bar pattern speed does not seem to change with redshift and that all bars are compatible with being fast bars.
If the bars analysed are long-lasting, their size and bar strength have not significantly changed in time. The fact that, independent of the redshift, the bars are fast rotators and their size has not significantly changed in time could also have strong implications for bar evolution models that mostly predict a bar growth with time. It has been argued that the exchange of angular momentum with a centrally dense halo causes the bar to evolve; but the present results may imply that the disc in the high surface-brightness galaxies is maximal and the central mass density is dominated by the stellar component, which would lower the angular momentum exchange between the disc and the halo and slow down the bar evolution (e.g., Debattista & Sellwood 2000; but for a different conclusion, see Athanassoula 2003).
This is the first time that the pattern speed evolution has been investigated from the observational point of view. The results presented here place strong constraints on the bar evolution models.
Online material
Appendix A: Sample galaxies
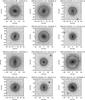 |
Fig. A.1 Low-redshift sample with black solid circles indicating the ring size. |
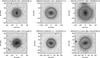 |
Fig. A.1 continued. |
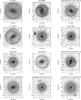 |
Fig. A.2 High-redshift sample with black solid circles indicating the ring size. |
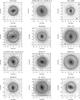 |
Fig. A.2 continued. |
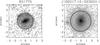 |
Fig. A.2 continued. |
Acknowledgments
We thank the referee for his/her useful comments. We would like to thank Victor Debattista for the careful reading of the manuscript. I.P. was supported by the Spanish Ministry of Science and Innovation (MICINN) (via grants AYA2010-21322-C03-02, AYA2010-21322-C03-03, AYA2007-67625-C02-02 and Consolider-Ingenio CSD2010-00064) and by the Junta de Andalucía (FQM-108). J.A.L.A. and J.M.A. were supported by the projects AYA2010-21887-C04-04 and by the Consolider-Ingenio 2010 Program grant CSD2006-00070.
References
- Abraham, R. G., Merrifield, M. R., Ellis, R. S., Tanvir, N. R., & Brinchmann, J. 1999, MNRAS, 308, 569 [NASA ADS] [CrossRef] [Google Scholar]
- Adelman-McCarthy, J. K., Agüeros, M. A., Allam, S. S., et al. 2007, ApJS, 172, 634 [NASA ADS] [CrossRef] [Google Scholar]
- Aguerri, J. A. L. 1999, A&A, 351, 43 [NASA ADS] [Google Scholar]
- Aguerri, J. A. L., Beckman, J. E., & Prieto, M. 1998, AJ, 116, 2136 [Google Scholar]
- Aguerri, J. A. L., Muñoz-Tuñón, C., Varela, A. M., & Prieto, M. 2000a, A&A, 361, 841 [NASA ADS] [Google Scholar]
- Aguerri, J. A. L., Varela, A. M., Prieto, M., & Muñoz-Tuñón, C. 2000b, AJ, 119, 1638 [NASA ADS] [CrossRef] [Google Scholar]
- Aguerri, J. A. L., Hunter, J. H., Prieto, M., et al. 2001, A&A, 373, 786 [NASA ADS] [CrossRef] [EDP Sciences] [Google Scholar]
- Aguerri, J. A. L., Debattista, V. P., & Corsini, E. M. 2003, MNRAS, 338, 465 [NASA ADS] [CrossRef] [Google Scholar]
- Aguerri, J. A. L., Elias-Rosa, N., Corsini, E. M., & Muñoz-Tuñón, C. 2005, A&A, 434, 109 [NASA ADS] [CrossRef] [EDP Sciences] [Google Scholar]
- Aguerri, J. A. L., Méndez-Abreu, J., & Corsini, E. M. 2009, A&A, 495, 491 [NASA ADS] [CrossRef] [EDP Sciences] [Google Scholar]
- Athanassoula, E. 1992, MNRAS, 259, 345 [NASA ADS] [CrossRef] [Google Scholar]
- Athanassoula, E. 2002, ApJ, 569, L83 [NASA ADS] [CrossRef] [Google Scholar]
- Athanassoula, E. 2003, MNRAS, 341, 1179 [NASA ADS] [CrossRef] [Google Scholar]
- Athanassoula, E. 2005, MNRAS, 358, 1477 [NASA ADS] [CrossRef] [Google Scholar]
- Athanassoula, E., & Misiriotis, A. 2002, MNRAS, 330, 35 [NASA ADS] [CrossRef] [Google Scholar]
- Athanassoula, E., Bosma, A., Creze, M., & Schwarz, M. P. 1982, A&A, 107, 101 [NASA ADS] [Google Scholar]
- Athanassoula, E., Romero-Gómez, M., Bosma, A., & Masdemont, J. J. 2010, MNRAS, 407, 1433 [NASA ADS] [CrossRef] [Google Scholar]
- Barazza, F. D., Jogee, S., & Marinova, I. 2008, ApJ, 675, 1194 [NASA ADS] [CrossRef] [Google Scholar]
- Barazza, F. D., Jablonka, P., Desai, V., et al. 2009, A&A, 497, 713 [NASA ADS] [CrossRef] [EDP Sciences] [Google Scholar]
- Barway, S., Wadadekar, Y., & Kembhavi, A. K. 2011, MNRAS, 410, L18 [NASA ADS] [CrossRef] [Google Scholar]
- Bournaud, F., & Combes, F. 2002, A&A, 392, 83 [NASA ADS] [CrossRef] [EDP Sciences] [Google Scholar]
- Bournaud, F., Combes, F., & Semelin, B. 2005, MNRAS, 364, L18 [Google Scholar]
- Bureau, M., & Freeman, K. C. 1999, AJ, 118, 126 [NASA ADS] [CrossRef] [Google Scholar]
- Buta, R. 1986, ApJS, 61, 609 [NASA ADS] [CrossRef] [Google Scholar]
- Buta, R., & Crocker, D. A. 1991, AJ, 102, 1715 [NASA ADS] [CrossRef] [Google Scholar]
- Buta, R., & Block, D. L. 2001, ApJ, 550, 243 [NASA ADS] [CrossRef] [Google Scholar]
- Buta, R., van Driel, W., Braine, J., et al. 1995, ApJ, 450, 593 [NASA ADS] [CrossRef] [Google Scholar]
- Buta, R., Laurikainen, E., Salo, H., & Knapen, J. H. 2010, ApJ, 721, 259 [NASA ADS] [CrossRef] [Google Scholar]
- Byrd, G., Rautiainen, P., Salo, H., Buta, R., & Crocher, D. A. 1994, AJ, 108, 476 [NASA ADS] [CrossRef] [Google Scholar]
- Canzian, B. 1993, ApJ, 414, 487 [NASA ADS] [CrossRef] [Google Scholar]
- Cepa, J., & Beckman, J. E. 1990, ApJ, 349, 497 [NASA ADS] [CrossRef] [Google Scholar]
- Chemin, L., & Hernandez, O. 2009, A&A, 499, L25 [NASA ADS] [CrossRef] [EDP Sciences] [Google Scholar]
- Contopoulos, G. 1980, A&A, 81, 198 [NASA ADS] [Google Scholar]
- Contopoulos, G., & Grosbol, P. 1989, A&ARv, 1, 261 [NASA ADS] [CrossRef] [Google Scholar]
- Corsini, E. M. 2011, Mem. Soc. Astron. Ital. Suppl., 18, 23 [NASA ADS] [Google Scholar]
- Corsini, E. M., Debattista, V. P., & Aguerri, J. A. L. 2003, ApJ, 599, L29 [NASA ADS] [CrossRef] [Google Scholar]
- Corsini, E. M., Aguerri, J. A. L., Debattista, V. P., et al. 2007, ApJ, 659, L121 [NASA ADS] [CrossRef] [Google Scholar]
- Das, M., Teuben, P. J., Vogel, S. N., et al. 2003, ApJ, 582, 190 [NASA ADS] [CrossRef] [Google Scholar]
- Debattista, V. P., & Sellwood, J. A. 1998, ApJ, 493, L5 [NASA ADS] [CrossRef] [Google Scholar]
- Debattista, V. P., & Sellwood, J. A. 2000, ApJ, 543, 704 [NASA ADS] [CrossRef] [Google Scholar]
- Debattista, V. P., Corsini, E. M., & Aguerri, J. A. L. 2002, MNRAS, 332, 65 [NASA ADS] [CrossRef] [Google Scholar]
- Debattista, V. P., Carollo, C. M., Mayer, L., & Moore, B. 2004, ApJ, 604, L93 [NASA ADS] [CrossRef] [Google Scholar]
- Debattista, V. P., Mayer, L., Carollo, C. M., et al. 2006, ApJ, 645, 209 [NASA ADS] [CrossRef] [Google Scholar]
- Duval, M. F., & Athanassoula, E. 1983, A&A, 121, 297 [NASA ADS] [Google Scholar]
- Elmegreen, B. G., & Elmegreen, D. M. 1990, ApJ, 355, 52 [NASA ADS] [CrossRef] [Google Scholar]
- Elmegreen, B. G., Elmegreen, D. M., & Hirst, A. C. 2004, ApJ, 612, 191 [NASA ADS] [CrossRef] [Google Scholar]
- Emsellem, E., Fathi, K., Wozniak, H., et al. 2006, MNRAS, 365, 367 [NASA ADS] [CrossRef] [Google Scholar]
- England, M. N. 1989, ApJ, 344, 669 [NASA ADS] [CrossRef] [Google Scholar]
- Erwin, P. 2005, MNRAS, 364, 283 [NASA ADS] [CrossRef] [Google Scholar]
- Eskridge, P. B., Frogel, J. A., Pogge, R. W., et al. 2000, AJ, 119, 536 [NASA ADS] [CrossRef] [Google Scholar]
- Fasano, G., Amico, P., Bertola, F., Vio, R., & Zeilinger, W. W. 1993, MNRAS, 262, 109 [NASA ADS] [CrossRef] [Google Scholar]
- Fathi, K., Toonen, S., Falcón-Barroso, J., et al. 2007, ApJ, 667, L137 [NASA ADS] [CrossRef] [Google Scholar]
- Fathi, K., Beckman, J. E., Piñol-Ferrer, N., et al. 2009, ApJ, 704, 1657 [NASA ADS] [CrossRef] [Google Scholar]
- Faure, C., Kneib, J.-P., Covone, G., et al. 2008, ApJS, 176, 19 [NASA ADS] [CrossRef] [Google Scholar]
- Gabbasov, R. F., Repetto, P., & Rosado, M. 2009, ApJ, 702, 392 [NASA ADS] [CrossRef] [Google Scholar]
- Gadotti, D. A. 2008, MNRAS, 384, 420 [NASA ADS] [CrossRef] [Google Scholar]
- Gadotti, D. A. 2011, MNRAS, 415, 3308 [NASA ADS] [CrossRef] [Google Scholar]
- Hernandez, O., Wozniak, H., Carignan, C., et al. 2005, ApJ, 632, 253 [NASA ADS] [CrossRef] [Google Scholar]
- Hoyle, B., Masters, K. L., Nichol, R. C., et al. 2011, MNRAS, 415, 3627 [NASA ADS] [CrossRef] [Google Scholar]
- Hunter, Jr., J. H., England, M. N., Gottesman, S. T., Ball, R., & Huntley, J. M. 1988, ApJ, 324, 721 [NASA ADS] [CrossRef] [Google Scholar]
- Ilbert, O., Arnouts, S., McCracken, H. J., et al. 2006, A&A, 457, 841 [NASA ADS] [CrossRef] [EDP Sciences] [Google Scholar]
- Jedrzejewski, R. I. 1987, MNRAS, 226, 747 [Google Scholar]
- Jogee, S., Barazza, F. D., Rix, H.-W., et al. 2004, ApJ, 615, L105 [NASA ADS] [CrossRef] [Google Scholar]
- Knapen, J. H., Shlosman, I., & Peletier, R. F. 2000, ApJ, 529, 93 [NASA ADS] [CrossRef] [Google Scholar]
- Koekemoer, A. M., Aussel, H., Calzetti, D., et al. 2007, ApJS, 172, 196 [NASA ADS] [CrossRef] [Google Scholar]
- Kormendy, J. 1979, ApJ, 227, 714 [NASA ADS] [CrossRef] [Google Scholar]
- Kormendy, J., & Kennicutt, Jr., R. C. 2004, ARA&A, 42, 603 [NASA ADS] [CrossRef] [Google Scholar]
- Laine, S., Shlosman, I., & Heller, C. H. 1998, MNRAS, 297, 1052 [NASA ADS] [CrossRef] [Google Scholar]
- Laine, S., Shlosman, I., Knapen, J. H., & Peletier, R. F. 2002, ApJ, 567, 97 [NASA ADS] [CrossRef] [Google Scholar]
- Laurikainen, E., Salo, H., & Buta, R. 2005, MNRAS, 362, 1319 [NASA ADS] [CrossRef] [Google Scholar]
- Laurikainen, E., Salo, H., Buta, R., & Knapen, J. H. 2007, MNRAS, 381, 401 [NASA ADS] [CrossRef] [Google Scholar]
- Li, C., Gadotti, D. A., Mao, S., & Kauffmann, G. 2009, MNRAS, 397, 726 [NASA ADS] [CrossRef] [Google Scholar]
- Lilly, S. J., Le Fèvre, O., Renzini, A., et al. 2007, ApJS, 172, 70 [NASA ADS] [CrossRef] [Google Scholar]
- Lindblad, P. A. B., Lindblad, P. O., & Athanassoula, E. 1996, A&A, 313, 65 [NASA ADS] [Google Scholar]
- Maciejewski, W. 2006, MNRAS, 371, 451 [NASA ADS] [CrossRef] [Google Scholar]
- Marinova, I., & Jogee, S. 2007, ApJ, 659, 1176 [NASA ADS] [CrossRef] [Google Scholar]
- Martin, P. 1995, AJ, 109, 2428 [NASA ADS] [CrossRef] [Google Scholar]
- Martinet, L., & Friedli, D. 1997, A&A, 323, 363 [NASA ADS] [Google Scholar]
- Martinez-Valpuesta, I., Shlosman, I., & Heller, C. 2006, ApJ, 637, 214 [NASA ADS] [CrossRef] [Google Scholar]
- Masters, K. L., Nichol, R. C., Hoyle, B., et al. 2011, MNRAS, 411, 2026 [NASA ADS] [CrossRef] [Google Scholar]
- Meidt, S. E., Rand, R. J., & Merrifield, M. R. 2009, ApJ, 702, 277 [NASA ADS] [CrossRef] [Google Scholar]
- Méndez-Abreu, J., Corsini, E. M., Debattista, V. P., et al. 2008, ApJ, 679, L73 [NASA ADS] [CrossRef] [Google Scholar]
- Méndez-Abreu, J., Sánchez-Janssen, R., & Aguerri, J. A. L. 2010, ApJ, 711, L61 [NASA ADS] [CrossRef] [Google Scholar]
- Menéndez-Delmestre, K., Sheth, K., Schinnerer, E., Jarrett, T. H., & Scoville, N. Z. 2007, ApJ, 657, 790 [NASA ADS] [CrossRef] [Google Scholar]
- Merrifield, M. R., & Kuijken, K. 1995, MNRAS, 274, 933 [NASA ADS] [CrossRef] [Google Scholar]
- Michel-Dansac, L., & Wozniak, H. 2006, A&A, 452, 97 [NASA ADS] [CrossRef] [EDP Sciences] [Google Scholar]
- Mobasher, B., Capak, P., Scoville, N. Z., et al. 2007, ApJS, 172, 117 [NASA ADS] [CrossRef] [Google Scholar]
- Nair, P. B., & Abraham, R. G. 2010, ApJ, 714, L260 [NASA ADS] [CrossRef] [Google Scholar]
- Ohta, K., Hamabe, M., & Wakamatsu, K.-I. 1990, ApJ, 357, 71 [NASA ADS] [CrossRef] [Google Scholar]
- Pérez, I., Fux, R., & Freeman, K. 2004, A&A, 424, 799 [NASA ADS] [CrossRef] [EDP Sciences] [Google Scholar]
- Pérez, I., Márquez, I., Freeman, K., & Fux, R. 2005, A&A, 438, 127 [NASA ADS] [CrossRef] [EDP Sciences] [Google Scholar]
- Pérez, I., Sánchez-Blázquez, P., & Zurita, A. 2009, A&A, 495, 775 [NASA ADS] [CrossRef] [EDP Sciences] [Google Scholar]
- Pfenniger, D., & Friedli, D. 1991, A&A, 252, 75 [NASA ADS] [Google Scholar]
- Pfenniger, D., & Norman, C. 1990, ApJ, 363, 391 [NASA ADS] [CrossRef] [Google Scholar]
- Prieto, M., Gottesman, S. T., Aguerri, J.-A. L., & Varela, A.-M. 1997, AJ, 114, 1413 [NASA ADS] [CrossRef] [Google Scholar]
- Prieto, M., Aguerri, J. A. L., Varela, A. M., & Muñoz-Tuñón, C. 2001, A&A, 367, 405 [NASA ADS] [CrossRef] [EDP Sciences] [Google Scholar]
- Puerari, I., & Dottori, H. 1997, ApJ, 476, L73 [NASA ADS] [CrossRef] [Google Scholar]
- Quillen, A. C., Frogel, J. A., & Gonzalez, R. A. 1994, ApJ, 437, 162 [NASA ADS] [CrossRef] [Google Scholar]
- Rand, R. J., & Wallin, J. F. 2004, ApJ, 614, 142 [NASA ADS] [CrossRef] [Google Scholar]
- Rautiainen, P., Salo, H., & Laurikainen, E. 2005, ApJ, 631, L129 [NASA ADS] [CrossRef] [Google Scholar]
- Reese, A. S., Williams, T. B., Sellwood, J. A., Barnes, E. I., & Powell, B. A. 2007, AJ, 133, 2846 [NASA ADS] [CrossRef] [Google Scholar]
- Regan, M. W., & Mulchaey, J. S. 1999, AJ, 117, 2676 [NASA ADS] [CrossRef] [Google Scholar]
- Romano-Díaz, E., Shlosman, I., Heller, C., & Hoffman, Y. 2009, ApJ, 702, 1250 [NASA ADS] [CrossRef] [Google Scholar]
- Ryden, B. S. 2004, ApJ, 601, 214 [NASA ADS] [CrossRef] [Google Scholar]
- Sánchez-Blázquez, P., Ocvirk, P., Gibson, B. K., Pérez, I., & Peletier, R. F. 2011, MNRAS, 415, 709 [NASA ADS] [CrossRef] [Google Scholar]
- Schwarz, M. P. 1981, ApJ, 247, 77 [NASA ADS] [CrossRef] [Google Scholar]
- Schwarz, M. P. 1984a, MNRAS, 209, 93 [NASA ADS] [CrossRef] [Google Scholar]
- Schwarz, M. P. 1984b, A&A, 133, 222 [NASA ADS] [Google Scholar]
- Scoville, N., Aussel, H., Brusa, M., et al. 2007, ApJS, 172, 1 [NASA ADS] [CrossRef] [Google Scholar]
- Sellwood, J. A. 1981, A&A, 99, 362 [NASA ADS] [Google Scholar]
- Sellwood, J. A., & Wilkinson, A. 1993, Rep. Prog. Phys., 56, 173 [NASA ADS] [CrossRef] [Google Scholar]
- Sellwood, J. A., & Debattista, V. P. 2006, ApJ, 639, 868 [NASA ADS] [CrossRef] [Google Scholar]
- Sheth, K., Regan, M. W., Scoville, N. Z., & Strubbe, L. E. 2003, ApJ, 592, L13 [NASA ADS] [CrossRef] [Google Scholar]
- Sheth, K., Elmegreen, D. M., Elmegreen, B. G., et al. 2008, ApJ, 675, 1141 [NASA ADS] [CrossRef] [Google Scholar]
- Shlosman, I., Frank, J., & Begelman, M. C. 1989, Nature, 338, 45 [NASA ADS] [CrossRef] [Google Scholar]
- Tremaine, S., & Weinberg, M. D. 1984, ApJ, 282, L5 [Google Scholar]
- van den Bergh, S. 2002, AJ, 124, 782 [NASA ADS] [CrossRef] [Google Scholar]
- Villa-Vargas, J., Shlosman, I., & Heller, C. 2010, ApJ, 719, 1470 [NASA ADS] [CrossRef] [Google Scholar]
- Weinberg, M. D. 1985, MNRAS, 213, 451 [NASA ADS] [CrossRef] [Google Scholar]
- Weiner, B. J., Sellwood, J. A., & Williams, T. B. 2001, ApJ, 546, 931 [NASA ADS] [CrossRef] [Google Scholar]
- Weinzirl, T., Jogee, S., Khochfar, S., Burkert, A., & Kormendy, J. 2009, ApJ, 696, 411 [NASA ADS] [CrossRef] [Google Scholar]
- Whyte, L. F., Abraham, R. G., Merrifield, M. R., et al. 2002, MNRAS, 336, 1281 [NASA ADS] [CrossRef] [Google Scholar]
- Wozniak, H., Friedli, D., Martinet, L., Martin, P., & Bratschi, P. 1995, A&AS, 111, 115 [NASA ADS] [Google Scholar]
- Zánmar Sánchez, R., Sellwood, J. A., Weiner, B. J., & Williams, T. B. 2008, ApJ, 674, 797 [NASA ADS] [CrossRef] [Google Scholar]
- Zhang, X., & Buta, R. J. 2007, AJ, 133, 2584 [NASA ADS] [CrossRef] [Google Scholar]
- Zimmer, P., Rand, R. J., & McGraw, J. T. 2004, ApJ, 607, 285 [NASA ADS] [CrossRef] [Google Scholar]
All Tables
All Figures
|
Fig. 1 Left column: schematic view of the different ring types in barred galaxies (see Sect. 2.1). Ring type examples of barred galaxies at high- (middle column), and low- (right column) redshifts. |
| In the text | |
|
Fig. 2 Redshift distribution for the high-redshift sample. |
| In the text | |
|
Fig. 3 Three examples of the ringed galaxies selected from the SDSS data. From left to right: original r-band SDSS image, ellipticity isophotal radial profile, position angle radial profile of the isophotes, and deprojected image. The vertical full, dashed and dotted-dashed lines represent the Rbar − min, Rbar − max, and Rring, respectively. The horizontal full, dashed and dotted-dashed lines show the PA of the bar, ellipticity of the disc and PA of the disc, respectively. The circle represented in the right-most panels has a radius equal to the measured radius of the ring. |
| In the text | |
|
Fig. 4 Three examples of the ringed galaxies selected from the COSMOS data. From left to right: original r-band COSMOS image, ellipticity isophotal radial profile, position angle radial profile of the isophotes, and deprojected image. The vertical full, dashed and dotted-dashed lines represent the Rbar − min, Rbar − max, and Rring, respectively. The horizontal full, dashed and dotted-dashed lines show the PA of the bar, ellipticity of the disc and PA of the disc, respectively. The circle represented in the right-most panels has a radius equal to the measured radius of the ring. |
| In the text | |
|
Fig. 5 Top panel: bar semi-major axis vs. corotation radius for the high- and low-redshift sample. The sample was divided into three redshift bins; z ≈ 0 (solid black circles), z < 0.5 (solid blue squares), and z > 0.5 (solid red stars). The solid, dotted and dashed lines represent the values, from linear theory, of ℛ = RCR/Rbar = 1.0,1.2 and 1.4, respectively. This range corresponds to what is considered in the literature as fast bars (see Sect. 1). Bottom panel: outer ring radius vs. bar semi-major axes radius for the high- and low-redshift sample, the symbols and lines are the same as those represented in the top panel. Notice that all galaxies, regardless of their redshift, clearly fall into the “fast-bar” region. |
| In the text | |
|
Fig. A.1 Low-redshift sample with black solid circles indicating the ring size. |
| In the text | |
|
Fig. A.1 continued. |
| In the text | |
|
Fig. A.2 High-redshift sample with black solid circles indicating the ring size. |
| In the text | |
|
Fig. A.2 continued. |
| In the text | |
|
Fig. A.2 continued. |
| In the text | |
Current usage metrics show cumulative count of Article Views (full-text article views including HTML views, PDF and ePub downloads, according to the available data) and Abstracts Views on Vision4Press platform.
Data correspond to usage on the plateform after 2015. The current usage metrics is available 48-96 hours after online publication and is updated daily on week days.
Initial download of the metrics may take a while.