Fig. 5
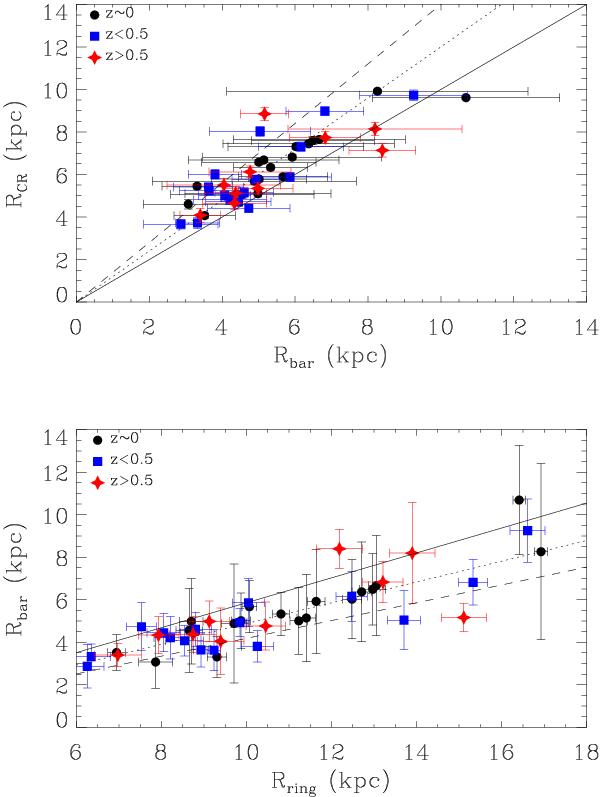
Top panel: bar semi-major axis vs. corotation radius for the high- and low-redshift sample. The sample was divided into three redshift bins; z ≈ 0 (solid black circles), z < 0.5 (solid blue squares), and z > 0.5 (solid red stars). The solid, dotted and dashed lines represent the values, from linear theory, of ℛ = RCR/Rbar = 1.0,1.2 and 1.4, respectively. This range corresponds to what is considered in the literature as fast bars (see Sect. 1). Bottom panel: outer ring radius vs. bar semi-major axes radius for the high- and low-redshift sample, the symbols and lines are the same as those represented in the top panel. Notice that all galaxies, regardless of their redshift, clearly fall into the “fast-bar” region.
Current usage metrics show cumulative count of Article Views (full-text article views including HTML views, PDF and ePub downloads, according to the available data) and Abstracts Views on Vision4Press platform.
Data correspond to usage on the plateform after 2015. The current usage metrics is available 48-96 hours after online publication and is updated daily on week days.
Initial download of the metrics may take a while.