| Issue |
A&A
Volume 540, April 2012
|
|
|---|---|---|
| Article Number | A136 | |
| Number of page(s) | 14 | |
| Section | Extragalactic astronomy | |
| DOI | https://doi.org/10.1051/0004-6361/201117632 | |
| Published online | 12 April 2012 | |
Dissecting the morphological and spectroscopic properties of galaxies in the local Universe
I. Elliptical galaxies⋆
1 Instituto de Astrofísica de Canarias, C/vía Láctea s/n, 38200 La Laguna, Spain
e-mail: This email address is being protected from spambots. You need JavaScript enabled to view it.
; This email address is being protected from spambots. You need JavaScript enabled to view it.
; This email address is being protected from spambots. You need JavaScript enabled to view it.
2 Departamento de Astrofísica de la Universidad de La Laguna, Spain
3 GEPI, Paris-Meudon Observatory, 5 place Jules Janssen, 92190 Meudon, France
4 Université Paris Diderot, 75205 Paris Cedex 13, France
e-mail: This email address is being protected from spambots. You need JavaScript enabled to view it.
Received: 5 July 2011
Accepted: 11 January 2012
Abstract
Aims. We revisit the scaling relations and star-forming histories of local elliptical galaxies using a novel selection method applied to the Sloan Digital Sky Survey DR7.
Methods. We combine two probability-based automated spectroscopic and morphological classifications of ~600 000 galaxies with z < 0.25 to isolate true elliptical galaxies. Our sample selection method does not introduce artificial cuts into the parameters describing the galaxy but instead associates every object with a weight measuring the probability of being in a given spectro-morphological class. Thus, the sample minimizes the selection biases.
Results. We show that morphologically defined ellipticals are basically distributed into three spectral classes, which dominate at different stellar masses. The bulk of the population (~50%) is formed by a well-defined class of galaxies with old stellar populations that formed their stars at very early epochs in a short episode of star formation. They dominate the scaling relations of elliptical galaxies known from previous works and represent the canonical elliptical class. At the low mass end, we find a population of ellipticals with relatively large shapes and smaller velocity dispersions at fixed stellar mass, which seem to have experienced a more recent episode of star formation probably triggered by gas-rich minor mergers. The high mass end tends to be dominated by a third spectral class that is slightly more metal rich and hosts more efficient stellar formation than the reference class. This third class contributes to the curvature in the mass-size relation at high masses reported in previous works. Our method is therefore able to isolate the typical spectra of elliptical galaxies following different evolutionary pathways.
Key words: galaxies: fundamental parameters / galaxies: evolution / galaxies: formation / galaxies: elliptical and lenticular, cD
Appendix A is available in electronic form at http://www.aanda.org
© ESO, 2012
1. Introduction
More than 50% of the stellar mass in the nearby universe is in early-type galaxies (see Persic & Salucci 1992; Fukugita et al. 1998). Understanding their formation and evolution is therefore one of the key questions in modern structure formation theories.
There is an ongoing debate about whether elliptical galaxies are the end products of a long history of major and/or minor dry/wet galaxy mergers (see e.g. De Lucia et al. 2006, hierarchical scenario) or they are passively evolving galaxies that formed at high redshift on a short timescale with almost no accretion of external material since their early formation (monolithic scenario; see e.g. Kodama et al. 1998; van Dokkum & Ellis 2003; Carretero et al. 2007). From the observational point of view, the scaling relations are a powerful tool for distinguishing between these two evolutionary paths.
The passively evolving scenario or monolithic collapse model (Partridge & Peebles 1967; Larson 1975) is consistent with the observation that early-type galaxies are, at first sight, a homogeneous family of objects with very regular morphologies (they do not have strong spiral arms or asymmetries like other types of galaxies; e.g. Abraham et al. 1996). In addition, their surface brightness distribution is concentrated toward the center, and can be well-fitted by a Sersic surface brightness profile (Caon et al. 1993; Trujillo et al. 2001; Graham & Guzmán 2003; Aguerri et al. 2004; Gutiérrez et al. 2004; Trujillo & Aguerri 2004; Kormendy et al. 2009). This regular morphology is also reflected in their regular colors (i.e., stellar populations). Early-type galaxies indeed form a well-defined family of galaxies in the color-magnitude diagram on the so-called red sequence (Kodama & Arimoto 1997; Bell et al. 2004; Balogh et al. 2004), which suggests that they are formed by old stellar populations of similar age with almost no star formation activity at present. This holds at least up to redshift one (Mei et al. 2009) and even up to redshift two (Andreon & Huertas-Company 2011). From the dynamical point of view, they are dominated by random motions with a high degree of virialization (see e.g. Kronawitter et al. 2000; Gerhard et al. 2001; Thomas et al. 2007). They consequently follow tight scaling relations defined by their size, velocity dispersion, surface brightness, and luminosity. The most commonly studied relations are: the luminosity/mass-size (Shen et al. 2003; McIntosh et al. 2005), the Faber-Jackson relation (Faber & Jackson 1976), the Kormendy relation (Kormendy 1977), and the fundamental plane (Djorgovski & Davis 1987; Dressler et al. 1987).
Detailed studies of the scaling relations of early-type galaxies have shown that despite their apparent homogeneity, there are important differences among them. Some works have found that the scaling relations and/or structural parameters of early-type galaxies depend on different galaxy properties, such as: luminosity (Bender et al. 1992; Caon et al. 1993; Desroches et al. 2007; Nigoche-Netro et al. 2008; Aguerri & González-García 2009; Nigoche-Netro et al. 2009, 2010; Bernardi et al. 2010), stellar populations (Forbes et al. 1998; Terlevich & Forbes 2002; Graves et al. 2009; Graves & Faber 2010), or environment (Aguerri et al. 2004; Gutiérrez et al. 2004; Fritz et al. 2005). Moreover, a strong size evolution is observed in early-type galaxies from high to low redshift (Daddi et al. 2005; Trujillo et al. 2006). These differences can be only understood if galaxies with different luminosities, stellar populations, or locations in different environments have experienced different formation histories. According to these properties, some authors have seen a dichotomy in the early-type population, and divided them in two different families. One of the families would be formed by the low luminous early-type galaxies. They show fast rotation, are isotropic oblate spheroids with disky isophotes, and show flat surface brightness profiles in their central regions (they are core-less objects). These galaxies are similar to bulges of spiral galaxies. In contrast, the more luminous or giant early-type galaxies are non-rotating, anisotropic and triaxial systems. In addition, they show cuspy cores and boxy isophotes. These galaxies are also older and more α-enhanced than the less luminous counterparts (Kormendy & Illingworth 1982; Nieto et al. 1991; Bender et al. 1992; Kormendy & Bender 1996; Faber et al. 1997; Lauer et al. 2005, 2007; Emsellem et al. 2007; Cappellari et al. 2007; Kormendy et al. 2009). This dichotomy has been challenged by other authors (Jerjen & Binggeli 1997; Graham & Guzmán 2003; Gavazzi et al. 2005).
The differences reported above in early-type galaxies could be explained if their formation history is somehow more complex than what is suggested by the monolithic scenario. Since the pioneering work by Toomre & Toomre (1972), it is thought that early-type galaxies can be formed by mergers of disk galaxies. Detailed simulations report that two equal disks do not survive after a merger process (Barnes & Hernquist 1991; Hernquist 1993; Barnes & Hernquist 1996; Mihos & Hernquist 1996; Di Matteo et al. 2005; Naab et al. 2006b; Robertson et al. 2006; Hopkins et al. 2009). The end product of such mergers is a galaxy with early-type morphology. These numerical simulations have also shown that the differences observed in the properties of early-type galaxies can be explained through the different physical processes taking place in such kind of mergers. This involves gas dissipation, star formation, and super-massive black hole feedback (Barnes 1992; Barnes & Hernquist 1996; Mihos & Hernquist 1996; Di Matteo et al. 2005; Robertson et al. 2006; Naab et al. 2006a,b, 2007; Hopkins et al. 2008). In particular, the gas fraction in the galaxy progenitors could play a crucial role in shaping the final merger remnants and fix their scaling relations (see, e.g., Robertson et al. 2006; Hopkins et al. 2008).
In addition, selection effects could be responsible of increasing the scatter of the observed scaling relations of early-type galaxies. Early-type galaxies are usually selected by their photometric properties, being the final samples contaminated by galaxies with disks (e.g. S0s) which are not pure spheroidal systems (see Bernardi et al. 2010). Color is also one of the most used selection criterion. However, it has been recently observed that the red sequence containts a large fraction ( ≈ 50%) of red spiral galaxies (see, e.g., Emsellem et al. 2007; Krajnović et al. 2008; Mahajan & Raychaudhury 2009; Masters et al. 2010; Sánchez-Almeida et al. 2011). The above contamination may explain differences in the reported scaling relations, since disks and spheroids follow different trends (see Shen et al. 2003).
In the present paper, we revisit the scaling relations of red-sequence elliptical galaxies using a new approach applied to one of the largest dataset of galaxies available today: the spectroscopic sample of the Sloan Digital Sky Survey Data Release 7 (SDSS-DR7). The new approach of the present work is probabilistic, based on the spectroscopic and morphological classifications recently developed by our group (Sánchez Almeida et al. 2010; Huertas-Company et al. 2011). This double classification provides a robust sample of early-type galaxies avoiding the contamination by other morphological types. Thus, early-type galaxies are formed by three different classes of objects according to their spectra, and we study the scaling relations of these three populations. The differences observed are interpreted in terms of different formation/evolution mechanisms.
The paper is organized as follows. We describe the sample selection in Sect. 2. Scaling relations such as color-mass, size-mass, Faber-Jackson, and the fundamental plane are shown in Sect. 3. The discussion and conclusions are given in Sects. 4 and 5, respectively. The cosmological parameters adopted through this paper were Ωm = 0.3, ΩΛ = 0.7, and H0 = 70 km s-1 Mpc-1. This paper is focused on elliptical galaxies (excluding S0s).
2. Sample selection
Our starting point for the sample selection is all galaxies in SDSS DR7 (Abazajian et al. 2009) with spectra of good quality (not too close to the edges of the survey, not saturated, and properly deblended), apparent magnitude in r brighter than 17.8, and redshift below 0.25 (see Sánchez Almeida et al. 2010, for a detailed description of the sample selection). As result, the final number of galaxies used in the present work is 698420.
Traditionally, early-type galaxies have been visually selected. This can be easily done for small and nearby galaxy samples. Nevertheless, visual classifications of samples as large as the one that we use are very time-consuming, and only by involving a large number of classifiers it can be done in a reasonable amount of time (e.g. Galaxy Zoo project Lintott et al. 2008, 2011). Automated galaxy classification techniques have been developed over the past few decades to classify large databases. The underlying principle of these techniques is that relatively simple criteria based on global galaxy properties can help to separate the different galaxy types. Thus, early-type galaxies have been selected according to: measurements of the surface brightness profiles (Aguerri & Trujillo 2002; Aguerri et al. 2004; Trujillo & Aguerri 2004; Gutiérrez et al. 2004; Méndez-Abreu et al. 2008), colors (Strateva et al. 2001), light concentration and asymmetry (Abraham et al. 1996), or some combination of photometric and spectroscopic information (Bernardi et al. 2003; Nigoche-Netro et al. 2010).
These classification schemes assume that the different types of galaxies are well-separated in the phase space defined by the considered parameters. Nevertheless, this is not the case. There is a continuous transition between the different galaxy types. This makes it difficult to define a pure elliptical galaxy sample since contaminations from other galaxy types are always present. In our present work, the selection of elliptical galaxies was done implicitly using a probability-based approach that had not been explored before. We use the full sample by weighting the derived relationships with the probability of being elliptical, both morphologically and spectroscopically. Thus, even if spirals and ellipticals with uncertain classifications are included, they do not contribute to the results.
The morphological classification is based on support vector machines (SVM). This is a machine-learning algorithm that tries to find the optimal boundary between several clouds of points in an N-dimensional space (for more details, see Huertas-Company et al. 2008). The galaxies of the SDSS DR7 spectroscopic sample were classified in four different morphological types (E, S0, Sab, and Scd). To each galaxy of the sample we associated a probability of being in these four morphological classes (see Huertas-Company et al. 2011). We also classified the galaxy spectra using the k-means clustering algorithm. This algorithm assumes that each galaxy spectra is a vector in a multi-dimensional space, with as many dimensions as the number of spectral wavelengths. It is assumed that the vectors are clustered around a number of cluster centers. The k-means algorithm finds the number of clusters, the cluster centers, and assigns to each galaxy one of the clusters. The galaxies of the sample were finally classified in 17 major ASK spectral classes, and each galaxy also has a probability of belonging to all classes (see Sánchez Almeida et al. 2010).
We combined the available spectroscopic and morphological information by assigning a weight (Pi(E)) to each galaxy. This weight is the product of the probability of the ith galaxy being morphologically classified as elliptical (Pi,morph(E)) and the probability of the galaxy belonging to the jth spectral class (Pi,ASK(Aj)). We note that Pi(E) would be a probability in the case that the two probabilities were independent. Otherwise, Pi(E) is just a weight that combines the spectroscopic and morphological information of each galaxy. In the following, we consider that, for each galaxy, the larger the value of Pi(E), the higher the probability of being elliptical.
Early-type galaxy samples usually include both elliptical and S0 galaxies. Nevertheless, these two kinds of galaxies are dynamically different. In particular, S0 galaxies have a disk structure that is absent in ellipticals. Their different dynamics can affect the scaling relations of the galaxies. Any differences observed between independent studies of the scaling relations of early-type galaxies could then be caused by these different dynamics, rather than different origins and/or evolutions (see e.g. Persic et al. 1996; Bell & de Jong 2001; Shen et al. 2003; Courteau et al. 2007). In order to have a sample of pure spheroidal systems, we did not include in Pi(E) the probability of each galaxy being classified as S0.
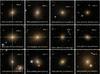 |
Fig. 1 Cutout images of EASK0 (top row), EASK2 (middle row), and EASK3 (bottom row) galaxies with the highest weights. |
 |
Fig. 2 Template spectra of the EASK0 (red), EASK2 (green), and EASK3 (blue) spectroscopic classes. The small panels zoom into the spectral ranges of the 4000 Å break (left), Mg absorption triplet (center), and Hα (right). The fluxes of the three spectra are in dimensionless units. They were normalized to the average flux in the g-filter bandpass. |
Galaxies classified morphologically as ellipticals do not belong to all ASK spectral classes. They are basically concentrated in the ASK classes called ASK0, ASK2, and ASK3 (see Sánchez Almeida et al. 2011). This concentration of elliptical galaxies into only three spectral classes occurs because blue galaxies with elliptical morphologies are very rare in the local universe (where they represent less than 10% of all ellipticals, see Kannappan et al. 2009; Sánchez Almeida et al. 2011). Although they are more common in the high redshift Universe (see Huertas-Company et al. 2010). Taking into account this approximation, the weight assigned to each galaxy of the catalog is given by  (1)where Pi,ASK(A0), Pi,ASK(A1), and Pi,ASK(A3) are the probabilities of belonging to the ASK0, ASK2, and ASK3 spectroscopic classes, respectively.
In our present study, we assigned three different weights to the family of elliptical galaxies, corresponding to their three different main spectral types (ASK0, ASK2, ASK3). Hereafter, we call to these classes as EASK0, EASK2, and EASK3, respectively. The values of the weights are given by 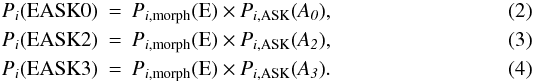 It is obvious from previous equations that Pi(E) = Pi(EASK0) + Pi(EASK2) + Pi(EASK3). In all relations analyzed throughout the paper, all galaxies contribute to each relation with the above weights. Figure 1 shows snapshots of the four galaxies with the highest Pi(EASK0),Pi(EASK2), and Pi(EASK3) values.
In nature, we would expect there to be a gradual transition between the different spectroscopic and morphological galaxy types. The approach presented here is therefore adapted to these characteristics in the sense that each galaxy of the catalog belongs to each of the EASK0, EASK2, and EASK3 classes in proportion to its weight. This has the advantage that we have not introduced additional biases into the selection of the elliptical galaxy sample. Our set of galaxies has the same biases as the SDSS DR7 spectroscopic catalog.
Figure 2 shows the mean spectra of the EASK0, EASK2, and EASK3 galaxies. These template spectra were obtained by combining the ASK0, ASK2, and ASK3 spectra weighted as given in Eqs. (2)−(4), respectively. We note that the three spectral classes correspond to galaxies that display typical spectra of early-type systems, i.e., well-defined 4000 Å breaks, strong absorption Balmer lines, and no strong emission lines. Weak emission lines can be observed at Hα, [NII], [SII], and [OII] wavelengths. Thus, galaxies from the ASK0, ASK2 and ASK3 classes have Hα equivalent widths EW(Hα) < 1 Å (see Sánchez Almeida et al. 2010). Similarly weak emission lines have been observed before in early-type galaxies. Thus, as many as 60% of early-type galaxies have EW(Hα) ≳ 0.5 Å (see, e.g., Phillips et al. 1986). We also note that the emission properties of ASK0, ASK2, and ASK3 galaxies coincide with the region of the BPT diagram (Baldwin et al. 1981) that is traditionally attributed to AGNs and LINERs (Sánchez Almeida et al. 2010). However, this region of the diagram is also characteristic of the ionization provided by old stellar populations (Binette et al. 1994; Stasińska et al. 2008), with the EW of Hα being the parameter that helps us to distinguish the two possibilities (Cid Fernandes et al. 2011). Thus, their weak emission lines, together with their position on the BPT diagram, seems to be consistent with EASK galaxies being retired galaxies where the interstellar medium is ionized by hot low-mass evolved stars.
The ASK classification does not provide a class of early-type galaxies without emission lines, which is the case for some nearby ellipticals already observed (see e.g. Bressan et al. 2006; Annibali et al. 2010; Panuzzo et al. 2011). Since most early-type galaxies have weak if any emission lines (see e.g. Phillips et al. 1986), automatic classification algorithm often fail to consider whether emission lines are present. To distinguish emission-line galaxies, one would need to refine the classes by re-running the classification on spectra of individual ASK classes (e.g., Morales-Luis et al. 2011), but such work has not yet been carried out.
2.1. Comparison with other samples of early-type galaxies
We quantify the contamination of our galaxy sample by spirals. We compare the apparent axis ratio distribution and the luminosity functions of our elliptical galaxies with other samples of visually classified ellipticals. In particular, we use as reference the published eyeball classification of 14 034 galaxies by Nair & Abraham (2010).
2.1.1. Apparent axis ratio distribution
The intrinsic structure of galaxies is related to their apparent axial ratio (b/a). Elliptical and disk galaxies have very different axial ratio distributions. In particular, the axial ratio distribution of ellipticals peaks at b/a ≈ 0.8, and decreases to zero at b/a ≈ 0.2. In contrast, disks have an almost flat b/a distribution in the range b/a = 0.2−0.8 (e.g., Tremblay & Merritt 1995; Padilla & Strauss 2008). In our approximation, the b/a distribution of the elliptical galaxies is given by 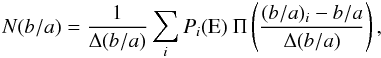 (5)where the sum is over all the galaxies in the sample, Δ(b/a) represents the bin size of the histogram, (b/a)i is the apparent axial ratio of the ith galaxy, and Π is the rectangle function given by
 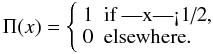 (6)We note that the histogram defined in Eq. (6) has an integral equal to ∑ iPi(E). Figure 3 shows this axial ratio distribution. We have also overplotted the axial ratio distributions of those galaxies morphologically classified as E, E+S0, and E+S0+Sab by Nair & Abraham (2010). We note that the b/a distributions of E, E+S0 and E+S0+Sab all peak at about b/a ~ 0.8. Nevertheless, the inclusion of disks changes the tail of the distribution. Thus, disks increase the fraction of galaxies with b/a < 0.5. In the Nair & Abraham sample, 2%, 4%, and 43% of the E, E+S0, and E+S0+Sab galaxies have b/a < 0.5. In our selected E sample, only 1% of the galaxies have b/a < 0.5. This indicates that the tail of the b/a distribution of our E sample is closer to the tail of the axial ratio distribution of the visually classified ellipticals. We can then conclude that our automated galaxy classification is insignificantly contaminated by disks, which would appear to follow an extended tail toward small b/a.
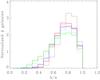 |
Fig. 3 Axial ratio distribution of elliptical galaxies as computed in this work (black full line). The axial ratio distributions of galaxies visually classified by Nair & Abraham (2010) as elliptical (red line), elliptical + S0 (blue line), and elliptical + S0+Sab (green line) are also overplotted. The dashed and dotted lines represent the axial ratios of early-type galaxies from Bernardi et al. (2003) and Strateva et al. (2001), respectively. All histograms have been normalized to the same area. |
We have also overplotted in Fig. 3 the axial ratio distribution of the early-type galaxies selected in Strateva et al. (2001) and Bernardi et al. (2003). As indicated by the tail of the distributions, both samples are contaminated by disk galaxies, the color-selected sample (Strateva et al. 2001) the most contaminated (see Bernardi et al. 2010, for a discussion of the biases in the selection of early-type galaxies).
The b/a distributions of EASK0, EASK2, and EASK3 galaxies can be computed by substituting in Eq. (5) Pi(E) with Pi(EASK0),Pi(EASK2), and Pi(EASK3), respectively. These b/a distributions are shown in Fig. 4. We do not find any systematic differences between the different spectral classes of galaxies and the global elliptical galaxy sample. This also indicates that if there is some disk contamination left, it is the same for the three classes of elliptical galaxies defined in the present work.
 |
Fig. 4 Axial ratio distributions of EASK0 (red), EASK2 (green), and EASK3 (blue) galaxies. All the histograms are normalized to their peaks. |
2.1.2. Luminosity function
 |
Fig. 5 Luminosity functions of our elliptical galaxies (top left, black open circles), EASK0 (top right, red open circles), EASK2 (bottom left, green open circles), and EASK3 (bottom right, blue open circles). In all panels, we provide as reference the luminosity functions of E (open stars), E+S0 (open squares), and E+S0+Sa (open diamonds) visually classified by Nair & Abraham (2010). The errors in the luminosity functions were computed by bootstraping. |
The galaxy luminosity function, Φ(L), is one of the fundamental statistics of galaxy studies. It measures the number of galaxies in a given volume per bin of luminosity. In magnitude-limited samples, its computation requires us to consider that brighter galaxies can be seen further away. This is done by computing Vmax, the maximum volume within which a galaxy of a given magnitude could have been detected. Each galaxy is then weighted by 1/Vmax. Thus, the number of elliptical galaxies per unit magnitude and volume is given by 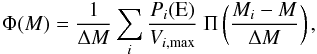 (7)where the sum comprises all the galaxies of the sample, ΔM represents magnitude bin size, and Vi,max is the maximum volume of the ith galaxy. In a similar way, we can compute the luminosity functions of EASK0, EASK2, and EASK3 galaxies by replacing Pi(E) with Pi(ASK0), Pi(ASK2), and Pi(ASK3).
Figure 5 shows the luminosity functions (LF) of our elliptical selected galaxies, and those of EASK0, EASK2, and EASK3 galaxies. We have also overplotted the LF of those galaxies visually selected as E, E+S0, and E+S0+Sa by Nair & Abraham (2010).
We note that the LF of our EASK0, EASK2, and EASK3, galaxies all combined, follows the LF of the visually identified ellipticals (top left panel of Fig. 5). In addition, Fig. 5 shows that EASK2 galaxies dominate the LF of our ellipticals at all absolute magnitudes. The LF of EASK3 galaxies are close to the LF of visually selected E galaxies at the low magnitude regime Mr < −18 (see also Sect. 4). These findings also imply that our sample of elliptical galaxies is not contaminated by disks.
3. Scaling relations of elliptical galaxies
We present the scaling properties of the galaxies EASK0, EASK2, and EASK3. The relations were derived including all galaxies but weighted according to Pi(EASK0), Pi(EASK2), and Pi(EASK3), respectively (see Sect. 2).
3.1. Color-mass diagram
Figure 6 shows the color-mass diagram of all the galaxies in the SDSS-DR7 spectroscopic sample. The mg − mr color of the galaxies was obtained from the Petrosian g and r magnitudes downloaded from the SDSS DR7 database. These magnitudes were corrected to account for Galactic dust attenuation and k-correction. Galactic absorptions and k-corrections were computed from the MPA-JHU DR7 spectrum measurements1 by subtracting the fiber magnitude and both the dereddening and deredshifted magnitudes of each galaxy (plug_mag and kor_mag). Stellar masses were obtained from the MPA-JHU DR7 release, which had computed following the strategy in Kauffmann et al. (2003). We have also overplotted in Fig. 6 the regions occupied by galaxies with Pi(EASK0) > 0.5, Pi(EASK2) > 0.5, and Pi(EASK3) > 0.5. These areas enclose the galaxies representative of the three spectral classes. We note that these galaxies populate the red-sequence of the color-mass diagram.
It can also be seen in Fig. 6 that the mass range of the three classes of galaxies is different. Thus, galaxies with Pi(EASK0) > 0.5 span the range 10.2 < log (Mstar) < 11.8, whereas those with Pi(EASK3) > 0.5 have 9.8 < log (Mstar) < 11.3. In contrast, galaxies with Pi(EASK2) > 0.5 occupy the full mass range (9.8 < log (Mstar < 12). We refer to Sect. 4 for a detailed dicussion of the mass distribution of the different classes.
We performed linear fits mg − mr = a + blog (Mstar) to the color-mass relation using Pi(E), Pi(EASK0), Pi(EASK2) and Pi(EASK3) as weights. The best-fit coefficients are given in Table 1. We note that for a given stellar mass, galaxies of class EASK3 are on average bluer.
3.2. Mass-size relation
According to the virial theorem, masses and sizes of galaxies are well-correlated, such that more massive (or luminous) galaxies are larger in size than their low mass counterparts. This correlation is the so-called mass/luminosity-size relation, and is followed by galaxies for all ranges of luminosities and morphological types. However, there are important differences which depend on the morphological type. In particular, the mass-size relation of early-type galaxies has a smaller scatter than the one of late-type systems, even if there is a strong dependence on luminosity (see Shen et al. 2003). Figure 7 shows the relation between the effective radius (re) and the stellar mass of the galaxies in our sample. We assumed that the radius containing 50% of the total petrosian galaxy luminosity is an estimate of re. Figure 7 also shows in color the location of the galaxies for which Pi(EASK0), Pi(EASK2), and Pi(EASK3) is larger than 0.5. We note that the size-mass relation is steeper for ellipticals than for the full set of galaxies, hence also disk galaxies. We also performed linear fits to the size-mass relation using Pi(EASK0), Pi(EASK2), and Pi(EASK3) as weights. They are shown in Fig. 7. The coefficients of the best fit log (re) = a + blog (Mstar) are listed in Table 1. We note that we also see deviations from a pure straight line at the low and high mass ends reported in previous works (see Bernardi et al. 2010).
 |
Fig. 6 Color-mass diagram of the galaxies from SDSS-DR7 spectroscopic sample (grey scale). Colored regions show the location of galaxies with Pi(EASK0) > 0.5 (red), Pi(EASK2) > 0.5 (green), and Pi(EASK3) > 0.5 (blue). The red, green, blue, and black solid lines represent linear fits to the color-mass relations weighted with Pi(EASK0), Pi(EASK2), Pi(EASK3), and Pi(E), respectively. |
 |
Fig. 7 Effective r-band radius (re) as a function of stellar mass for galaxies in the SDSS DR7 spectroscopic catalog (grey scale). The colored regions show the location of galaxies with Pi(EASK0) > 0.5 (red), Pi(EASK2) > 0.5 (green), and Pi(EASK3) > 0.5 (blue). The solid lines show the best linear weighted fits to the relations (see Fig. 6 for the color code of these lines). |
Coefficients of linear fits to the color-mass, size-mass, Faber-Jackson and FP relations for galaxies of type EASK0, EASK2, and EASK3, and all galaxies combined.
Galaxies in the EASK0 and EASK2 classes have similar size-mass relations. In contrast, galaxies of the EASK3 class follow a size-mass relation with a slightly different slope. In particular, for a given stellar mass, galaxies from the EASK3 class are larger in size. The relation obtained for all the three classes together (using P(E) as a weight) is consistent with the one reported by Hyde & Bernardi (2009) for their early-type galaxy sample (log (re) = (−4.79 ± 0.02) + (0.489 ± 0.002)log (Mstar)).
3.3. The fundamental plane
Galaxies are not located randomly in the space defined by the effective radius (re), velocity dispersion (σ), and mean effective surface brightness (Ie). They follow a tight relationship called the fundamental plane (FP; Djorgovski & Davis 1987; Dressler et al. 1987) given by  (8)This relation is a consequence of both the dynamical equilibrium (virial theorem) and the regular behavior of both the mass-to-luminosity ratio and structure of early-type galaxies. According to the virial theorem, α = 2 and β = 1. There are, however, differences between these theoretical values and those obtained from observations. These discrepancies correspond to the tilt of the FP, and imply that the mass-to-light ratio is a function of either galaxy mass or luminosity (M/L ∝ Lγ).
We adopted the approach of plotting the FP in the re vs.  virial plane coordinates (see e.g. Robertson et al. 2006). In this representation, the tilt of the FP can be quantified by the relation
 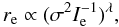 (9)where λ = 1 means an alignment of the FP with the virial expectation.
We used the velocity dispersion at the effective radius (σre) as an estimate of the central velocity dispersion (σ). Aperture corrections were however applied to the values given in the SDSS catalog. These corrections depend on the galaxy type since the shape of the velocity dispersion radial profile depends on morphology. Early-type galaxies can indeed have significantly steep radial gradients in their velocity dispersion, while late-type systems have almost flat profiles. Following our weight-based solution, the aperture correction applied to the velocity dispersion of each galaxy (σi,re) is given by  (10)where σi,SDSS is the velocity dispersion of the ith galaxy given in the SDSS-DR7 catalog2, Pi(E),Pi(S0),Pi(Sab), and Pi(Scd) are the probabilities of each galaxy to be classified as elliptical, S0, Sab, and Scd, respectively (see Huertas-Company et al. 2011), and σi,cor is the aperture correction for early-type galaxies given by Jorgensen et al. (1995), namely
  , and rap = 1.5 arcsec corresponds to the radius of the SDSS fiber. When either P(E),P(S0), or P(Sab) are large, the computed σ is close to the value given by Jorgensen et al. (1995). No aperture correction is taken into account for galaxies with a large probability of being Scd.
Figure 8 shows the distribution of all galaxies in the log (re) vs.  plane. We have also overplotted the location of galaxies with Pi(EASK0),Pi(EASK2), and Pi(EASK3) greater than 0.5. Figure 8 also shows the linear fits
  , when using these probabilities as weights. The coefficients of these relations are given in Table 1. All classes have FPs with a tilt (b ≠ 1). The tilt is however larger for EASK3 galaxies.
3.4. The Faber-Jackson relation
The Faber-Jackson relation (FJR; Faber & Jackson 1976) is one of the most well-studied projections of the fundamental plane. It shows a tight correlation between mass (luminosity) and central velocity dispersion for early-type galaxies, i.e. more massive (luminous) galaxies have larger central velocity dispersions. Figure 9 shows the FJR for all galaxies in our sample.
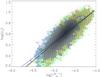 |
Fig. 8 Fundamental plane of all galaxies from the SDSS-DR7 spectroscopic catalog (grey scale). The colored regions show the location of galaxies with Pi(EASK0) > 0.5 (red), Pi(EASK2) > 0.5 (green), and Pi(EASK3) > 0.5 (blue). The continuous lines show the best linear weighted fits to the relations (colors of the solid lines as in Fig. 6). |
 |
Fig. 9 The Faber-Jackson relationship for the galaxies in the SDSS-DR7 spectroscopic catalog (grey scale). The colored regions show the location of galaxies with Pi(EASK0) > 0.5 (red), Pi(EASK2) > 0.5 (green), and Pi(EASK3) > 0.5 (blue). The solid lines correspond to the best linear weighted fits to the relations (colors of the solid lines as in Fig. 6). |
As in previous figures, we also show the locations of galaxies with Pi(E), Pi(EASK0), Pi(EASK2), and Pi(EASK3) greater than 0.5 and the best weighted linear fits log (σ) = a + blog (Mstar). Coefficients of the best-fit relations are given in Table 1. Galaxies of both the EASK0 and EASK2 classes again have similar FJRs. However, galaxies from EASK3 follow a different relation. Thus, for a fixed stellar mass, galaxies of type EASK3 have smaller velocity dispersions than those of both EASK0 and EASK2 classes. We also fitted the FJR for all the elliptical sample (see Table 1). This relation is also consistent with the one reported by Hyde & Bernardi (2009) for their early-type galaxy sample (log (σ) = (−0.86 ± 0.02) + (0.286 ± 0.002)log (Mstar)).
4. Discussion
We have presented the scaling relations of the three spectral classes defining our elliptical sample. Before interpreting them, we computed the total weight of EASK0, EASK2, and EASK3 galaxies. We found that 28% of the total weight corresponds to EASK0, 49% to EASK2, and 23% to EASK3. The type EASK2 galaxies therefore represent half of the total sample. We show in Fig. 10 the mass fraction (MF) of the three spectro-morphological classes. The MF of a given class (EASKi; i = 0, 2, or 3) and stellar mass (Mstar) was obtained with the expression  (11)where the sum is over all the galaxies of the sample of a given Mstar, and ΔM is the stellar mass bin. The EASK2 class clearly dominates in a wide range of stellar masses (10.2 < log (Mstar) < 11.7). The type EASK3 becomes dominant at the low mass-end (log (Mstar) < 10), while EASK0 galaxies tend to be more abundant at high stellar masses. In the following, we therefore consider the EASK2 class as the canonical class of elliptical galaxies, and interpret the relative differences seen in the two other classes.
 |
Fig. 10 Mass fraction of EASK0 (red points), EASK2 (green points), and EASK3 (blue points) galaxies in each stellar mass bin. |
We also studied the star formation histories (SFH) and metallicities of each spectro-morphological class. This provided an independent confirmation of the results based on the spectral indeces, and was performed using the data from Cid-Fernandes et al. (2005). They obtained the SFH of galaxies in the SDSS-DR7 spectroscopic catalog by using STARLIGHT, a code that fits the observed spectrum of each galaxy by a combination of single stellar populations (SSP) spectra of different ages and metallicities. Thus, the model spectrum is given by  (12)where bj,λ is the spectrum of the jth SSP normalized at λ0, Mλ0 is the synthetic flux at the normalization wavelength, N∗ is the number of SSPs used in the fit, xj is the population vector, and the symbol ⊗ denotes convolution. The extinction, rλ, assumes a galaxy-like law with a single free parameter (Cardelli et al. 1989). The modeled spectrum Mλ is convolved with a Gaussian distribution, G(v∗,σ∗), centered at velocity v∗ and with dispersion σ∗. Since all SSPs are assumed to have the same initial mass, the components of the population vector xj represent the fractional mass contribution of each SSP to the model flux at λ0. These models the SDSS-DR7 galaxies, Cid-Fernandes et al. used 150 single stellar population templates based on Bruzual & Charlot (2003) models combined according to Padova 1994 evolutionary tracks (Girardi 1996, and references therein). They cover a grid of 6 metallicities (from 0.005 to 2.5 times solar) and 25 ages (from 1 Myr to 18 Gyr). Further details are given in Sect. 2.1 of Asari et al. (2007). The STARLIGHT code searches for the minimum χ2 = Σλ((Oλ − Mλ) wλ)2, where Oλ is the observed spectrum and
  its errors. STARLIGHT uses the Metropolis scheme for the χ2 minimization (see Cid Fernandes et al. 2005, for a full description of the code).
The population vector xj of each galaxy in the SDSS sample was computed by Cid Fernandes (2010, priv. comm.). We used these vectors to help us to characterize mean SFHs and metallicities.
As in previous sections, the mean SFHs and metallicities of each spectro-morphological class of ellipticals were obtained by using Pi(EASK0), Pi(EASK2), and Pi(EASK3) as weights. Figure11 shows the results as the percentage of stellar mass created at each time, xj, and for each metallicity, Z.
Details are discussed below, but we note that most of the stars were created more than 10 Gyr ago, and have a high metallicity (solar or higher).
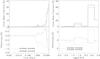 |
Fig. 11 Top row: mean star formation history (left pannel) and metallicities (right pannel) for galaxies of types EASK0 (red), EASK2 (green), and EASK3 (blue). Bottom row: differences of the SFH (left panel) and metallicities (right panel) from those of EASK2 galaxies. |
4.1. EASK2: canonical class of elliptical galaxies
The EASK2 galaxies represent 50% of all elliptical galaxies in our sample. Moreover, they are well-defined as a spectral class according to the ASK classification (see Fig. 8 from Sánchez Almeida et al. 2010) in the sense that they are well-clustered in the n-dimensional space, where each spectrum is a point. They clearly occupy the linear mass regime of the scaling relations defined by Bernardi et al. (2010). Consequently, the scaling relations of EASK2 are expected to be representative of the “elliptical class”. This is confirmed in Table 1, which illustrates that the fitting parameters of the scaling relations of EASK2 and all ellipticals are similar and consistent with previous published results.
For the SFH of these galaxies, Fig. 11 shows that 90% of the stars were already formed 10 Gyr ago. This is the expected formation history of the stellar population of a typical monolithic elliptical galaxy (see, e.g., Carretero et al. 2007). We can conclude that our classification scheme is able to distingish EASK2 galaxies as typical ellipticals that have standard scaling relations and star formation histories.
In addition, the class of elliptical galaxies consists of two slightly different populations, the EASK0 and EASK3 classes. This separation is a continuous transition (see Fig. 10) since these two classes are not as tightly clustered in the parameter space as galaxies of type EASK2 (see Fig. 8 as in Sánchez Almeida et al. 2010), although this does not mean that they are outliers of the main class. Galaxies of types EASK0 and EASK3 represent ~50% of all ellipticals. On average, EASK3 galaxies are bluer, larger, and less massive than the average galaxy, while galaxies of type EASK0 are slightly redder and more massive (see Figs. 6 and 10).
4.2. EASK0: Dry major-merger origin?
The EASK0 galaxies represent a significant fraction of the elliptical population at the high-mass end, where a curvature is clearly evident in the mass-size relation (Bernardi et al. 2010; see also Fig. 7). Bernardi et al. (2011) argue that this curvature might indicate that dry-mergers were more predominant in forming the high-mass end of the mass distribution (log (Mstar) > 11.3). Since EASK0 galaxies are more abundant at this mass, they contribute significantly to the curvature. We speculate that EASK0 galaxies could be elliptical galaxies that have experienced more major dry-merger events than the average population of ellipticals.
The mean SFH shows that a large fraction (about 90%) of their stars were already in place 10 Gyr ago, as we have found for EASK2 galaxies. Nevertheless, they have slightly higher metallicity than EASK2 galaxies (which may also account for the redder colors seen in the color-mass diagram; Fig. 6). This could imply that EASK0 galaxies formed stars in a more efficient way, in the sense that they consumed a larger fraction of the original gas leading to higher metallicities. The differences between the SFHs of EASK2 and EASK0 galaxies is indeed positive, meaning that EASK0 formed their stars somewhat earlier (see Fig. 11).
On the basis of the above arguments, we speculate that EASK0 galaxies could be representative of the brightest cluster galaxies (BCGs). These galaxies would be located in high galaxy density environments (mainly the centers of galaxy clusters). In these special regions, dry mergers are normal as gas stripping efficiently removes the gas content of galaxies on short timescales (see e.g., Quilis et al. 2000). If these hypotheses were correct, our classification scheme is able to isolate, among the population of elliptical galaxies, those that had experienced more major dry mergers and formed stars on average more efficiently (see Fig. 2). Moreover, even if dominant at high masses (as pointed out by Bernardi et al. 2011), EASK0 galaxies are present at all stellar masses.
We investigated the environment of the EASK0, EASK2, and EASK3 galaxies in the sample of Nair & Abraham (2010). Figure 12 shows the galaxy density (ρgal) of the EASK classes. As explained in Nair & Abraham (2010), the environmental overdensity was taken from Blanton et al. (2005). Thus, the galaxy neighbors of each galaxy of the catalog were considered as those galaxies in the magnitude range M∗ ± 1 and within 5 h-1 Mpc excluding the target galaxy. Figure 12 shows that EASK0 and EASK2 galaxies from Nair & Abraham (2010) live in higher galaxy density environments than those of type EASK3. We performed a Kolmogorov-Smirnov test, showing that the cumulative galaxy density distribution functions of EASK0 and EASK2 galaxies are statistically similar. In contrast, the cumulative galaxy density distribution function of the EASK3 galaxies is statistically different from those of types EASK0 and EASK2.
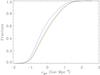 |
Fig. 12 Cumulative distribution function of the galaxy density of the EASK0 (red), EASK2 (green), and EASK3 (blue) galaxies in the sample of Nair & Abraham (2010). |
4.3. EASK3: wet minor mergers?
Galaxies in the color-mass diagram are thought to evolve from the blue cloud to the red sequence (see, e.g., Kauffmann et al. 2006). The bluer colors of EASK3 galaxies could possibly be caused by their recent arrival on to the red sequence. If true, EASK3 galaxies should be either poststarbust or E+A, galaxies. The E+A galaxies indeed contain a young stellar population together with a lack of going on star formation. We tested that possibility by determining the average value of the equivalent width (EW) of Hδ and [OII] lines for EASK0, EASK2, and EASK3. This was done by using the EWs provided to us by MPA-JHU DR7 spectrum measurements. We obtained ⟨ EW(Hδ) ⟩ = (−0.086 ± 0.003) Å, (−0.049 ± 0.002) Å, and (−0.0023 ± 0.004) Å for EASK0, EASK2, and EASK3 galaxies respectively. On the other hand, the ⟨ EW( [OII] ) ⟩ = (−2.99 ± 0.03) Å, (−2.25 ± 0.02) Å, and (−2.46 ± 0.03) Å for EASK0, EASK2, and EASK3 galaxies, respectively. These values rule out the hypothesis that EASK3 galaxies are dominated by E+A galaxies. This type of galaxies have typical EWs of EW(Hδ) > 5.0 Å and EW([OII]) > −2.5 Å (see Goto 2007).
Cold gas accretion into a galaxy halo can reach the central regions of the galaxy and turn on a central starburst (see Dekel et al. 2009). This is expected to happen at the intersection of filamentary structures of the Universe. Thus, this effect would be significant in galaxies with masses higher than ≈ 1012 M⊙ (Dekel & Birnboim 2006). Since EASK3 galaxies are essentially in the low mass end, we conclude that EASK3 galaxies are unlikely to have been rejuvenated by direct gas accreation, and we are left with the possibility that they were formed by mergers of galaxies with higher gas fractions than those forming EASK2 galaxies.
According to the structure formation scenario, mergers are the main driver of galaxy formation. In particular, the progenitors of elliptical galaxies could be either spheroidal or disk-like systems. The dissipative component of the progenitors plays an important role in determining the final properties of the remnants. Thus, during the merger process of gas-rich disk galaxies, part of the gas of the progenitors is driven toward the center of the remnant and feeds a central starburst that induces a rejuvenation of the central part of the final galaxy (see e.g. Di Matteo et al. 2005). This new generation of central stars can influence the structural parameters of the galaxies and produce changes in their scaling relations (see Robertson et al. 2006; Hopkins et al. 2008). Therefore, we expect that elliptical galaxies built up after wet mergers, or those with a wet last merger, will have younger stellar populations at their centers than those formed by dry mergers. We tested the possibility that galaxies from the EASK3 class are formed by mergers with a higher fraction of gas than those from EASK0 and EASK2 classes. In this case, we expect EASK3 to have younger stellar populations in their central regions than average. This seems to be happening according to the star formation histories represented in Fig. 11. In addition, we carried out an independent test by computing the mean age and metallicity of EASK0, EASK2, and EASK3 galaxies using the two Lick spectral indices: Hβ and [MgFe]′. The Hβ index is an age-sensitive index, whereas [MgFe]′ measures metallicity. Thomas et al. (2003) defined [MgFe]′ as ![Mathematical equation: \begin{equation} [\rm{MgFe}]{'}=\sqrt{\rm{Mgb} \times (0.72 \rm{Fe5270} +0.28 \rm{Fe5335})}, \end{equation}](/articles/aa/full_html/2012/04/aa17632-11/aa17632-11-eq170.png) (13)where Mgb, Fe5270, and Fe5335 are Lick indices.
(13)where Mgb, Fe5270, and Fe5335 are Lick indices.
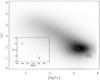 |
Fig. 13 Hβ versus [MgFe]′ of the galaxies from SDSS-DR7 (grey scale). The asterisks show the mean values of the two indices for EASK0 (red), EASK2 (green), and EASK3 (blue) galaxies. |
The [MgFe]′ index is a good tracer of the total metallicity of the stellar populations owing to its independence of age and α/Fe (see Thomas et al. 2003), and enables the age-metallicity degeneracy to be broken. The Lick indices of the galaxies were obtained from MPA-JHU web page. The indices used were those measured in the rest-frame spectrum after substraction of all 3σ emission lines3. Figure 13 shows the Hβ versus [MgFe]′ for the galaxies from SDSS-DR7 database. We have also overploted the mean values of these two indices for EASK0, EASK2, and EASK3 galaxies. We determined the stellar population properties (age and metallicity) of each elliptical galaxy class using the program R-model (Cardiel et al. 2003). Our results indicate that EASK3 galaxies are about 2 Gyr younger than galaxies from EASK0 and EASK2 classes. This is in full agreement with the SFH seen for these galaxies in Fig. 11 where it is also evident that EASK3 galaxies have a more extended SFH than the canonical ellipticals (EASK2). While only about 10% of the stars from EASK0 and EASK2 galaxies are formed in the last 8 Gyr, EASK3 galaxies then formed up to 20% of their stars.
Age and/or metallicity gradients have been observed in some early-type galaxies. These gradients, together with the aperture bias introduced by the 3′′ diameter of the SDSS fibers, could potentially create age differences between our classes of ellipticals. To attempt to discard this problem, we divided our galaxies into two groups of those  and
and  . In both groups, EASK3 galaxies are about 2 Gyr younger than EASK0 and EASK2 galaxies, but the second group insensitive to aperture bias since the SDSS fiber covers most of galaxy. We therefore exclude the possibility that the difference of age is due to aperture bias.
Early-type galaxies can be produced by major mergers of equal-mass disks or spheroidal galaxies. Nevertheless, several minor mergers can also produce galaxies with photometrical and dynamical properties typical of early-type galaxies. In particular, repeated minor mergers can form spheroidal galaxy components with Sersic shape parameter n from 1 to 4 (Aguerri et al. 2001; Eliche-Moral et al. 2006; Bournaud et al. 2007) or produce galaxies with ratios of the mean velocity to mean velocity dispersion (V/σ) similar to those of early-type galaxies (Bournaud et al. 2007). Minor mergers with large gas fractions can also activate central starbursts and lead to the rejuvenation of the central regions of galaxies (Bournaud et al. 2007; Kaviraj et al. 2009).
The structural parameters of the final remnant depend on the merger type, because the mass of the progenitors is deposited in a different way in major and minor mergers. Thus, major mergers can easily increase the mass density at the galaxy centers. In contrast, minor progenitors lose a large fraction of the mass in the outer regions of the main progenitor (see Aguerri et al. 2001; Eliche-Moral et al. 2006). Robertson et al. (2006) and Hopkins et al. (2008) investigated the scaling relations of early-type remnants formed by major disk-like galaxies with different gas fractions. They showed that progenitors with a larger fraction of gas produce remnants following steeper size-mass relations and having larger central velocity dispersions. They also showed that the remnants of gas-rich mergers are located in a FP with a steeper tilt than those from progenitors with small gas fractions. Our elliptical galaxies from EASK3 follow a FP with a steeper tilt than EASK2 galaxies. This could be related to the larger gas fraction of the progenitors of the galaxies from EASK3. In contrast, the size-mass and FJ relations of EASK3 galaxies have shallower slopes. This agrees with the gas-rich major merger scenario modeled by Robertson et al. (2006) and Hopkins et al. (2008). We conclude that the rejuvenation of the central regions of the EASK3 galaxies does not seem to be caused by gas-rich major mergers.
We can therefore conjeture that EASK3 galaxies have experienced more dissipative minor mergers than the average ellipticals. Minor mergers indeed increase the effective radius and decrease the central velocity dispersion of the galaxies (see Naab et al. 2009). Our classification scheme can therefore provide the typical spectrum of this kind of galaxies (see Fig. 2). The dissipative minor mergers undergone by EASK3 galaxies might also indicate that these galaxies are located in relatively less dense environments (see Fig. 12). This assumption would agree with the percentages of the different classes of elliptical galaxies reported previously in this paper. Thus, it is well-known that more than 50% of galaxies are located in clusters or in group environments (see e.g., Ramella et al. 2002). This is particularly true for elliptical galaxies (see e.g., Dressler 1980). This implies that more than 50% of elliptical galaxies are located in clusters or group environments. We have seen in the previous sections that EASK0 and EASK2 galaxies are located in similar environments and represent about 80% of our ellipticals. In contrast, EASK3 galaxies are located in less dense environments and represent about 20% of the total sample. According to this numbers, we can say that EASK3 galaxies could be located in either the outskirts of galaxy clusters or the field. In these environments, gas stripping is less prevalent and small galaxies can retain most of their gas content. Thus, the environment could also explain the mass dichotomy observed in Fig. 10. The role of environment in the age and metallicity of early-type galaxies was also observed by Clemens et al. (2006, 2009). As for the results obtained here, they found that early-type galaxies located in the field were younger than those located in clusters. They proposed that the assembly processes of elliptical galaxies are independent of the environment, although occur most gradually. This might agree with our results if dissipative minor mergers events were active until later times for EASK3 galaxies than for the other two classes.
5. Conclusions
We have isolated a sample of elliptical galaxies in the SDSS DR7 using an automated probabilty-based spectro-morphological classification. We have shown that morphologically defined ellipticals are basically distributed into three spectral classes (EASK0, EASK2, EASK3). For each of these three spectral classes, we have studied the classical scaling relations (color-mass, mass-size, Faber-Jackson, and fundamental plane), as well as star formation histories, metallicities, and mass distributions.
The typical elliptical, understood as a galaxy which follows normal scaling relations of ellipticals, falls into our EASK2 class. This class represents ~50% of the whole population and essentially dominates at intermediate stellar masses. The bulk of their stellar content was already in place 10 Gyr ago. At the high mass end, EASK0 galaxies are more abundant. These ellipticals are slightly more metal rich and seem to have formed stars in a more efficient way than EASK2 galaxies. The tilt of the mass-size relation at high masses lead us to conclude that these galaxies could have experienced more dry mergers than the average. The low mass end is dominated by the EASK3 ellipticals. They are bluer, larger, and have smaller velocity dispersions at a fixed stellar mass. Moreover, they have a more extended stellar formation history, i.e., 20% of their stars were formed in the last 8 Gyr, compared to 10% for the other classes. Minor gas-rich mergers could be the main driver of the evolution of these objects if the rejuvenation of these galaxies comes from their central parts. This should be verified (at least for the smallest galaxies) by upcoming studies of stellar population gradients.
The environment could be the main parameter behind the differences observed between the elliptical galaxy classes reported in this paper. We propose that the EASK0 galaxies could be the brightest cluster galaxies, located at the centers of galaxy clusters, where gas can be swept from galaxies on short timescales by gas stripping. Thus, dry galaxy mergers would subsequently be the main drivers of the evolution of galaxies located in these environments. In contrast, EASK2 galaxies could be located in less dense environments where the gas stripping mechanism is less prevalent and galaxies retain their gas content.
Finally, we emphasize that our classification can help to isolate the spectra of elliptical galaxies with different evolutionary pathways, which could not be done with classical mass and/or color cuts. As a consequence, the present work can be used as a reference for studies at higher redshift. In upcoming papers, we will continue dissecting the spectro-morphological properties of local galaxies by extending this study to other galaxy classes.
Online material
Appendix A: Dependence of the results on the effective radius measurements
 |
Fig. A.1 Effective r-band radius from Simard et al. (2011) as a function of stellar mass for galaxies in the SDSS DR7 spectroscopic catalog (grey scale). The colors and lines are as in Fig. 7. |
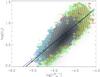 |
Fig. A.2 Fundamental plane of the galaxies from SDSS-DR7 spectrosocpic catalog (grey color) using the effective radius given by Simard et al. (2011). The colors and lines are as in Fig. 8. |
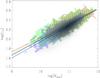 |
Fig. A.3 The Faber-Jackson relation of the galaxies from SDSS-DR7 spectrosocpic catalog (grey color) using the effective radius given by Simard et al. (2011). The colors and lines are as in Fig. 9. |
We defined the effective radius of the galaxies to be the radius containing 50% of the total Petrosian galaxy luminosity. This radius is not corrected for seeing, which may affect the scaling relations presented in this work. We estimated this influence by measuring the mass-size relation of our elliptical galaxies using the effective radius given by Simard et al. (2011). This different estimate was obtained by fitting the surface brightness distribution of the SDSS-DR7 galaxies with Sérsic models (see Simard et al. 2011). These models provide structural parameters of the galaxies after seeing corrections. We studied the influence of the used effective radius on the size-mass, fundamental plane, and Faber-Jackson relations, i.e., the relations involving re.
Figure A.1 shows the mass-size relations of EASK0, EASK2, and EASK3 galaxies computed in Sect. 3.2, but using the effective radius given by Simard et al. (2011). The fits of the
size-mass relations showed in Fig. A.1 are given in Table A.1. We note that the relations obtained here are consistent with those obtained in Sect. 3.2. In particular, for a given stellar mass, galaxies from the EASK3 class are also larger.
Figure A.2 shows the fundamental plane (FP) of EASK0, EASK2, and EASK3 galaxies computed using the effective radius measured by Simard et al. (2011). The fits to these FPs are shown in Table A.1. Notice that the behavior is similar to that reported in Sect. 3.3. In particular, all classes have FPs with a non-zero tilt, which is steeper for EASK3 galaxies. In this case, the tilts of the FPs are closer to the virial plane (b = 1) than those reported in Sect. 3.3.
Figure A.3 and Table A.1 show the Faber-Jackson relations of EASK0, EASK2, and EASK3 galaxies derived using the effective radius of the galaxies from Simard et al. (2011). In this case, the behavior and fits to the relations are the same as those reported in Sect. 3.4.
We can conclude that the results inferred from the scaling relationships of EASK0, EASK2, and EASK3 galaxies do not depend on the way the effective radius is measured.
Coefficients of linear fits to the size-mass, Faber-Jackson and FP relations of EASK0, EASK2, and EASK3 galaxies, and for all galaxies combined, using the effective radii corrected for seeing by Simard et al. (2011).
The velocity dispersion of the galaxies was corrected for the spectral resolution of SDSS.
Acknowledgments
We would like to thank to J. Falcon Barroso for fruitful comments and discussion about stellar population in early-type galaxies. We are also indebted to with R. Cid Fernandes for making available the SFH data of the SDSS-DR7 galaxies. Our thanks are conveved to the referee for helping us to improve both the content and the presentation of the manuscript. This work was supported by the projects AYA2010-21887-C04-04 and by the Consolideer-Ingenio 2010 Program grant CSD2006-00070. Funding for the Sloan Digital Sky Survey (SDSS) and SDSS-II has been provided by the Alfred P. Sloan Foundation, the Participating Institutions, the National Science Foundation, the US Department of Energy, the National Aeronautics and Space Administration, the Japanese Monbukagakusho, and the Max Planck Society, and the Higher Education Funding Council for England. The SDSS Web site is http://www.sdss.org/. The SDSS is managed by the Astrophysical Research Consortium (ARC) for the Participating Institutions. The Participating Institutions are the American Museum of Natural History, Astrophysical Institute Potsdam, University of Basel, University of Cambridge, Case Western Reserve University, The University of Chicago, Drexel University, Fermilab, the Institute for Advanced Study, the Japan Participation Group, The Johns Hopkins University, the Joint Institute for Nuclear Astrophysics, the Kavli Institute for Particle Astrophysics and Cosmology, the Korean Scientist Group, the Chinese Academy of Sciences (LAMOST), Los Alamos National Laboratory, the Max-Planck-Institute for Astronomy (MPIA), the Max-Planck-Institute for Astrophysics (MPA), New Mexico State University, Ohio State University, University of Pittsburgh, University of Portsmouth, Princeton University, the United States Naval Observatory, and the University of Washington.
References
- Abazajian, K. N., Adelman-McCarthy, J. K., Agüeros, M. A., et al. 2009, ApJS, 182, 543 [NASA ADS] [CrossRef] [Google Scholar]
- Abraham, R. G., Tanvir, N. R., Santiago, B. X., et al. 1996, MNRAS, 279, L47 [NASA ADS] [CrossRef] [Google Scholar]
- Aguerri, J. A. L., & González-García, A. C. 2009, A&A, 494, 891 [NASA ADS] [CrossRef] [EDP Sciences] [Google Scholar]
- Aguerri, J. A. L., & Trujillo, I. 2002, MNRAS, 333, 633 [NASA ADS] [CrossRef] [Google Scholar]
- Aguerri, J. A. L., Balcells, M., & Peletier, R. F. 2001, A&A, 367, 428 [NASA ADS] [CrossRef] [EDP Sciences] [Google Scholar]
- Aguerri, J. A. L., Iglesias-Paramo, J., Vilchez, J. M., & Muñoz-Tuñón, C. 2004, AJ, 127, 1344 [NASA ADS] [CrossRef] [Google Scholar]
- Aguerri, J. A. L., Girardi, M., Boschin, W., et al. 2011, A&A, 527, A143 [NASA ADS] [CrossRef] [EDP Sciences] [Google Scholar]
- Andreon, S., & Huertas-Company, M. 2011, A&A, 526, A11 [NASA ADS] [CrossRef] [EDP Sciences] [Google Scholar]
- Annibali, F., Bressan, A., Rampazzo, R., et al. 2010, A&A, 519, A40 [NASA ADS] [CrossRef] [EDP Sciences] [Google Scholar]
- Asari, N. V., Cid Fernandes, R., Stasińska, G., et al. 2007, MNRAS, 381, 263 [NASA ADS] [CrossRef] [MathSciNet] [Google Scholar]
- Baldwin, J. A., Phillips, M. M., & Terlevich, R. 1981, PASP, 93, 5 [NASA ADS] [CrossRef] [EDP Sciences] [Google Scholar]
- Balogh, M. L., Baldry, I. K., Nichol, R., et al. 2004, ApJ, 615, L101 [NASA ADS] [CrossRef] [Google Scholar]
- Barnes, J. E. 1992, ApJ, 393, 484 [NASA ADS] [CrossRef] [Google Scholar]
- Barnes, J. E., & Hernquist, L. E. 1991, ApJ, 370, L65 [NASA ADS] [CrossRef] [Google Scholar]
- Barnes, J. E., & Hernquist, L. 1996, ApJ, 471, 115 [NASA ADS] [CrossRef] [Google Scholar]
- Bell, E. F., & de Jong, R. S. 2001, ApJ, 550, 212 [NASA ADS] [CrossRef] [Google Scholar]
- Bell, E. F., Wolf, C., Meisenheimer, K., et al. 2004, ApJ, 608, 752 [NASA ADS] [CrossRef] [Google Scholar]
- Bender, R., Burstein, D., & Faber, S. M. 1992, ApJ, 399, 462 [NASA ADS] [CrossRef] [Google Scholar]
- Bernardi, M., Sheth, R. K., Annis, J., et al. 2003, AJ, 125, 1817 [NASA ADS] [CrossRef] [Google Scholar]
- Bernardi, M., Shankar, F., Hyde, J. B., et al. 2010, MNRAS, 404, 2087 [NASA ADS] [Google Scholar]
- Bernardi, M., Roche, N., Shankar, F., & Sheth, R. K. 2011, MNRAS, 412, L6 [NASA ADS] [CrossRef] [Google Scholar]
- Binette, L., Magris, C. G., Stasińska, G., & Bruzual, A. G. 1994, A&A, 292, 13 [NASA ADS] [Google Scholar]
- Blanton, M. R., Eisenstein, D., Hogg, D. W., Schlegel, D. J., & Brinkmann, J. 2005, ApJ, 629, 143 [NASA ADS] [CrossRef] [Google Scholar]
- Bournaud, F., Jog, C. J., & Combes, F. 2007, A&A, 476, 1179 [NASA ADS] [CrossRef] [EDP Sciences] [Google Scholar]
- Bressan, A., Panuzzo, P., Buson, L., et al. 2006, ApJ, 639, L55 [NASA ADS] [CrossRef] [Google Scholar]
- Bruzual, G., & Charlot, S. 2003, MNRAS, 344, 1000 [NASA ADS] [CrossRef] [Google Scholar]
- Caon, N., Capaccioli, M., & D’Onofrio, M. 1993, MNRAS, 265, 1013 [NASA ADS] [CrossRef] [Google Scholar]
- Cappellari, M., Emsellem, E., Bacon, R., et al. 2007, MNRAS, 379, 418 [NASA ADS] [CrossRef] [Google Scholar]
- Cardelli, J. A., Clayton, G. C., & Mathis, J. S. 1989, ApJ, 345, 245 [NASA ADS] [CrossRef] [Google Scholar]
- Cardiel, N., Gorgas, J., Sánchez-Blázquez, P., et al. 2003, A&A, 409, 511 [NASA ADS] [CrossRef] [EDP Sciences] [Google Scholar]
- Carretero, C., Vazdekis, A., & Beckman, J. E. 2007, MNRAS, 375, 1025 [NASA ADS] [CrossRef] [Google Scholar]
- Cid Fernandes, R., Mateus, A., Sodré, L., Stasińska, G., & Gomes, J. M. 2005, MNRAS, 358, 363 [NASA ADS] [CrossRef] [Google Scholar]
- Cid Fernandes, R., Asari, N. V., Sodré, L., et al. 2007, MNRAS, 375, L16 [NASA ADS] [CrossRef] [Google Scholar]
- Cid Fernandes, R., Stasińska, G., Mateus, A., & Vale Asari, N. 2011, MNRAS, 413, 1687 [NASA ADS] [CrossRef] [Google Scholar]
- Clemens, M. S., Bressan, A., Nikolic, B., et al. 2006, MNRAS, 370, 702 [NASA ADS] [CrossRef] [Google Scholar]
- Clemens, M. S., Bressan, A., Nikolic, B., & Rampazzo, R. 2009, MNRAS, 392, L35 [NASA ADS] [CrossRef] [Google Scholar]
- Courteau, S., Dutton, A. A., van den Bosch, F. C., et al. 2007, ApJ, 671, 203 [NASA ADS] [CrossRef] [Google Scholar]
- Daddi, E., Renzini, A., Pirzkal, N., et al. 2005, ApJ, 626, 680 [NASA ADS] [CrossRef] [Google Scholar]
- Dekel, A., & Birnboim, Y. 2006, MNRAS, 368, 2 [NASA ADS] [CrossRef] [Google Scholar]
- Dekel, A., Sari, R., & Ceverino, D. 2009, ApJ, 703, 785 [Google Scholar]
- De Lucia, G., Springel, V., White, S. D. M., Croton, D., & Kauffmann, G. 2006, MNRAS, 366, 499 [NASA ADS] [CrossRef] [Google Scholar]
- Desroches, L.-B., Quataert, E., Ma, C.-P., & West, A. A. 2007, MNRAS, 377, 402 [NASA ADS] [CrossRef] [Google Scholar]
- Di Matteo, T., Springel, V., & Hernquist, L. 2005, Nature, 433, 604 [NASA ADS] [CrossRef] [PubMed] [Google Scholar]
- Djorgovski, S., & Davis, M. 1987, ApJ, 313, 59 [NASA ADS] [CrossRef] [Google Scholar]
- Dressler, A. 1980, ApJ, 236, 351 [NASA ADS] [CrossRef] [Google Scholar]
- Dressler, A., Lynden-Bell, D., Burstein, D., et al. 1987, ApJ, 313, 42 [NASA ADS] [CrossRef] [Google Scholar]
- Eliche-Moral, M. C., Balcells, M., Aguerri, J. A. L., & González-García, A. C. 2006, A&A, 457, 91 [NASA ADS] [CrossRef] [EDP Sciences] [Google Scholar]
- Emsellem, E., Cappellari, M., Krajnovi, D., et al. 2007, MNRAS, 379, 401 [NASA ADS] [CrossRef] [Google Scholar]
- Faber, S. M., & Jackson, R. E. 1976, ApJ, 204, 668 [NASA ADS] [CrossRef] [Google Scholar]
- Faber, S. M., Tremaine, S., Ajhar, E. A., et al. 1997, AJ, 114, 1771 [NASA ADS] [CrossRef] [Google Scholar]
- Forbes, D. A., Ponman, T. J., & Brown, R. J. N. 1998, ApJ, 508, L43 [NASA ADS] [CrossRef] [Google Scholar]
- Fritz, A., Ziegler, B. L., Bower, R. G., Smail, I., & Davies, R. L. 2005, MNRAS, 358, 233 [NASA ADS] [CrossRef] [Google Scholar]
- Fukugita, M., Hogan, C. J., & Peebles, P. J. E. 1998, ApJ, 503, 518 [NASA ADS] [CrossRef] [Google Scholar]
- Gavazzi, G., Donati, A., Cucciati, O., et al. 2005, A&A, 430, 411 [NASA ADS] [CrossRef] [EDP Sciences] [Google Scholar]
- Gerhard, O., Kronawitter, A., Saglia, R. P., & Bender, R. 2001, AJ, 121, 1936 [NASA ADS] [CrossRef] [Google Scholar]
- Girardi, L., Bressan, A., Chiosi, C., Bertelli, G., & Nasi, E. 1996, A&AS, 117, 113 [NASA ADS] [CrossRef] [EDP Sciences] [Google Scholar]
- Goto, T. 2007, MNRAS, 381, 187 [NASA ADS] [CrossRef] [Google Scholar]
- Graham, A. W., & Guzmán, R. 2003, AJ, 125, 2936 [NASA ADS] [CrossRef] [Google Scholar]
- Graves, G. J., & Faber, S. M. 2010, ApJ, 717, 803 [NASA ADS] [CrossRef] [Google Scholar]
- Graves, G. J., Faber, S. M., & Schiavon, R. P. 2009, ApJ, 698, 1590 [NASA ADS] [CrossRef] [Google Scholar]
- Gutiérrez, C. M., Trujillo, I., Aguerri, J. A. L., Graham, A. W., & Caon, N. 2004, ApJ, 602, 664 [NASA ADS] [CrossRef] [Google Scholar]
- Hernquist, L. 1993, ApJ, 409, 548 [NASA ADS] [CrossRef] [Google Scholar]
- Huertas-Company, M., Rouan, D., Tasca, L., Soucail, G., & Le Fèvre, O. 2008, A&A, 478, 971 [NASA ADS] [CrossRef] [EDP Sciences] [Google Scholar]
- Huertas-Company, M., Aguerri, J. A. L., Tresse, L., et al. 2010, A&A, 515, A3 [NASA ADS] [CrossRef] [EDP Sciences] [Google Scholar]
- Huertas-Company, M., Aguerri, J. A. L., Bernardi, M., Mei, S., & Sánchez Almeida, J. 2011, A&A, 525, A157 [NASA ADS] [CrossRef] [EDP Sciences] [Google Scholar]
- Hopkins, P. F., Cox, T. J., & Hernquist, L. 2008, ApJ, 689, 17 [NASA ADS] [CrossRef] [Google Scholar]
- Hopkins, P. F., Somerville, R. S., Cox, T. J., et al. 2009, MNRAS, 397, 802 [NASA ADS] [CrossRef] [Google Scholar]
- Hyde, J. B., & Bernardi, M. 2009, MNRAS, 394, 1978 [NASA ADS] [CrossRef] [Google Scholar]
- Jerjen, H., & Binggeli, B. 1997, The Nature of Elliptical Galaxies, 2nd Stromlo Symposium, 116, 239 [Google Scholar]
- Jorgensen, I., Franx, M., & Kjaergaard, P. 1995, MNRAS, 276, 1341 [NASA ADS] [Google Scholar]
- Kannappan, S. J., Guie, J. M., & Baker, A. J. 2009, AJ, 138, 579 [NASA ADS] [CrossRef] [Google Scholar]
- Kauffmann, G., Heckman, T. M., White, S. D. M., et al. 2003, MNRAS, 341, 33 [NASA ADS] [CrossRef] [Google Scholar]
- Kauffmann, G., Heckman, T. M., De Lucia, G., et al. 2006, MNRAS, 367, 1394 [NASA ADS] [CrossRef] [Google Scholar]
- Kaviraj, S., Peirani, S., Khochfar, S., Silk, J., & Kay, S. 2009, MNRAS, 394, 1713 [NASA ADS] [CrossRef] [Google Scholar]
- Kodama, T., & Arimoto, N. 1997, A&A, 320, 41 [NASA ADS] [Google Scholar]
- Kodama, T., Arimoto, N., Barger, A. J., & Arag’on-Salamanca, A. 1998, A&A, 334, 99 [NASA ADS] [Google Scholar]
- Kormendy, J. 1977, ApJ, 218, 333 [NASA ADS] [CrossRef] [Google Scholar]
- Kormendy, J., & Bender, R. 1996, ApJ, 464, L119 [NASA ADS] [CrossRef] [Google Scholar]
- Kormendy, J., & Illingworth, G. 1982, ApJ, 256, 460 [NASA ADS] [CrossRef] [Google Scholar]
- Kormendy, J., Fisher, D. B., Cornell, M. E., & Bender, R. 2009, ApJS, 182, 216 [NASA ADS] [CrossRef] [Google Scholar]
- Krajnović, D., Bacon, R., Cappellari, M., et al. 2008, MNRAS, 390, 93 [NASA ADS] [CrossRef] [Google Scholar]
- Kronawitter, A., Saglia, R. P., Gerhard, O., & Bender, R. 2000, A&AS, 144, 53 [NASA ADS] [CrossRef] [EDP Sciences] [Google Scholar]
- Lauer, T. R., Faber, S. M., Gebhardt, K., et al. 2005, AJ, 129, 2138 [NASA ADS] [CrossRef] [Google Scholar]
- Lauer, T. R., Gebhardt, K., Faber, S. M., et al. 2007, ApJ, 664, 226 [NASA ADS] [CrossRef] [Google Scholar]
- Larson, R. B. 1975, MNRAS, 173, 671 [NASA ADS] [CrossRef] [Google Scholar]
- Lintott, C. J., Schawinski, K., Slosar, A., et al. 2008, MNRAS, 389, 1179 [NASA ADS] [CrossRef] [Google Scholar]
- Lintott, C., Schawinski, K., Bamford, S., et al. 2011, MNRAS, 410, 166 [NASA ADS] [CrossRef] [Google Scholar]
- Masters, K. L., Mosleh, M., Romer, A. K., et al. 2010, MNRAS, 405, 783 [NASA ADS] [Google Scholar]
- Mahajan, S., & Raychaudhury, S. 2009, MNRAS, 400, 687 [NASA ADS] [CrossRef] [Google Scholar]
- McIntosh, D. H., Bell, E. F., Rix, H.-W., et al. 2005, ApJ, 632, 191 [NASA ADS] [CrossRef] [Google Scholar]
- Mei, S., Holden, B. P., Blakeslee, J. P., et al. 2009, ApJ, 690, 42 [NASA ADS] [CrossRef] [Google Scholar]
- Méndez-Abreu, J., Aguerri, J. A. L., Corsini, E. M., & Simonneau, E. 2008, A&A, 487, 555 [NASA ADS] [CrossRef] [EDP Sciences] [Google Scholar]
- Mihos, J. C., & Hernquist, L. 1996, ApJ, 464, 641 [NASA ADS] [CrossRef] [Google Scholar]
- Morales-Luis, A. B., Sánchez Almeida, J., Aguerri, J. A. L., & Muñoz-Tuñón, C. 2011, ApJ, 743, 77 [NASA ADS] [CrossRef] [Google Scholar]
- Naab, T., Khochfar, S., & Burkert, A. 2006a, ApJ, 636, L81 [NASA ADS] [CrossRef] [Google Scholar]
- Naab, T., Jesseit, R., & Burkert, A. 2006b, MNRAS, 372, 839 [NASA ADS] [CrossRef] [Google Scholar]
- Naab, T., Johansson, P. H., Ostriker, J. P., & Efstathiou, G. 2007, ApJ, 658, 710 [NASA ADS] [CrossRef] [Google Scholar]
- Naab, T., Johansson, P. H., & Ostriker, J. P. 2009, ApJ, 699, L178 [NASA ADS] [CrossRef] [Google Scholar]
- Nair, P. B., & Abraham, R. G. 2010, ApJS, 186, 427 [NASA ADS] [CrossRef] [Google Scholar]
- Nieto, J.-L., Bender, R., Arnaud, J., & Surma, P. 1991, A&A, 244, L25 [NASA ADS] [Google Scholar]
- Nigoche-Netro, A., Ruelas-Mayorga, A., & Franco-Balderas, A. 2008, A&A, 491, 731 [NASA ADS] [CrossRef] [EDP Sciences] [Google Scholar]
- Nigoche-Netro, A., Ruelas-Mayorga, A., & Franco-Balderas, A. 2009, MNRAS, 392, 1060 [NASA ADS] [CrossRef] [Google Scholar]
- Nigoche-Netro, A., Aguerri, J. A. L., Lagos, P., et al. 2010, A&A, 516, A96 [NASA ADS] [CrossRef] [EDP Sciences] [Google Scholar]
- Padilla, N. D., & Strauss, M. A. 2008, MNRAS, 388, 1321 [NASA ADS] [Google Scholar]
- Partridge, R. B., & Peebles, P. J. E. 1967, ApJ, 147, 868 [NASA ADS] [CrossRef] [Google Scholar]
- Panuzzo, P., Rampazzo, R., Bressan, A., et al. 2011, A&A, 528, A10 [NASA ADS] [CrossRef] [EDP Sciences] [Google Scholar]
- Persic, M., & Salucci, P. 1992, MNRAS, 258, 14P [NASA ADS] [CrossRef] [Google Scholar]
- Persic, M., Salucci, P., & Stel, F. 1996, MNRAS, 281, 27 [NASA ADS] [CrossRef] [Google Scholar]
- Phillips, M. M., Jenkins, C. R., Dopita, M. A., Sadler, E. M., & Binette, L. 1986, AJ, 91, 1062 [NASA ADS] [CrossRef] [Google Scholar]
- Quilis, V., Moore, B., & Bower, R. 2000, Science, 288, 1617 [NASA ADS] [CrossRef] [PubMed] [Google Scholar]
- Ramella, M., Geller, M. J., Pisani, A., & da Costa, L. N. 2002, AJ, 123, 2976 [NASA ADS] [CrossRef] [Google Scholar]
- Robertson, B., Cox, T. J., Hernquist, L., et al. 2006, ApJ, 641, 21 [NASA ADS] [CrossRef] [Google Scholar]
- Sánchez Almeida, J., Aguerri, J. A. L., Muñoz-Tuñón, C., & de Vicente, A. 2010, ApJ, 714, 487 [NASA ADS] [CrossRef] [Google Scholar]
- Sánchez Almeida, J., Aguerri, J. A. L., Muñoz-Tuñón, C., & Huertas-Company, M. 2011, ApJ, in press [Google Scholar]
- Shen, S., Mo, H. J., White, S. D. M., et al. 2003, MNRAS, 343, 978 [NASA ADS] [CrossRef] [Google Scholar]
- Simard, L., Mendel, J. T., Patton, D. R., Ellison, S. L., & McConnachie, A. W. 2011, ApJS, 196, 11 [NASA ADS] [CrossRef] [Google Scholar]
- Stasińska, G., Vale Asari, N., Cid Fernandes, R., et al. 2008, MNRAS, 391, L29 [NASA ADS] [Google Scholar]
- Strateva, I., Ivezić, Ž., Knapp, G. R., et al. 2001, AJ, 122, 1861 [Google Scholar]
- Terlevich, A. I., & Forbes, D. A. 2002, MNRAS, 330, 547 [NASA ADS] [CrossRef] [Google Scholar]
- Thomas, D., Maraston, C., & Bender, R. 2003, MNRAS, 339, 897 [NASA ADS] [CrossRef] [Google Scholar]
- Thomas, J., Saglia, R. P., Bender, R., et al. 2007, MNRAS, 382, 657 [NASA ADS] [CrossRef] [Google Scholar]
- Toomre, A., & Toomre, J. 1972, ApJ, 178, 623 [NASA ADS] [CrossRef] [Google Scholar]
- Tremblay, B., & Merritt, D. 1995, AJ, 110, 1039 [NASA ADS] [CrossRef] [Google Scholar]
- Trujillo, I., & Aguerri, J. A. L. 2004, MNRAS, 355, 82 [NASA ADS] [CrossRef] [Google Scholar]
- Trujillo, I., Aguerri, J. A. L., Gutiérrez, C. M., & Cepa, J. 2001, AJ, 122, 38 [NASA ADS] [CrossRef] [Google Scholar]
- Trujillo, I., Förster Schreiber, N. M., Rudnick, G., et al. 2006, ApJ, 650, 18 [NASA ADS] [CrossRef] [Google Scholar]
- van Dokkum, P. G., & Ellis, R. S. 2003, ApJ, 592, L53 [NASA ADS] [CrossRef] [Google Scholar]
All Tables
Coefficients of linear fits to the color-mass, size-mass, Faber-Jackson and FP relations for galaxies of type EASK0, EASK2, and EASK3, and all galaxies combined.
Coefficients of linear fits to the size-mass, Faber-Jackson and FP relations of EASK0, EASK2, and EASK3 galaxies, and for all galaxies combined, using the effective radii corrected for seeing by Simard et al. (2011).
All Figures
|
Fig. 1 Cutout images of EASK0 (top row), EASK2 (middle row), and EASK3 (bottom row) galaxies with the highest weights. |
| In the text | |
|
Fig. 2 Template spectra of the EASK0 (red), EASK2 (green), and EASK3 (blue) spectroscopic classes. The small panels zoom into the spectral ranges of the 4000 Å break (left), Mg absorption triplet (center), and Hα (right). The fluxes of the three spectra are in dimensionless units. They were normalized to the average flux in the g-filter bandpass. |
| In the text | |
|
Fig. 3 Axial ratio distribution of elliptical galaxies as computed in this work (black full line). The axial ratio distributions of galaxies visually classified by Nair & Abraham (2010) as elliptical (red line), elliptical + S0 (blue line), and elliptical + S0+Sab (green line) are also overplotted. The dashed and dotted lines represent the axial ratios of early-type galaxies from Bernardi et al. (2003) and Strateva et al. (2001), respectively. All histograms have been normalized to the same area. |
| In the text | |
|
Fig. 4 Axial ratio distributions of EASK0 (red), EASK2 (green), and EASK3 (blue) galaxies. All the histograms are normalized to their peaks. |
| In the text | |
|
Fig. 5 Luminosity functions of our elliptical galaxies (top left, black open circles), EASK0 (top right, red open circles), EASK2 (bottom left, green open circles), and EASK3 (bottom right, blue open circles). In all panels, we provide as reference the luminosity functions of E (open stars), E+S0 (open squares), and E+S0+Sa (open diamonds) visually classified by Nair & Abraham (2010). The errors in the luminosity functions were computed by bootstraping. |
| In the text | |
|
Fig. 6 Color-mass diagram of the galaxies from SDSS-DR7 spectroscopic sample (grey scale). Colored regions show the location of galaxies with Pi(EASK0) > 0.5 (red), Pi(EASK2) > 0.5 (green), and Pi(EASK3) > 0.5 (blue). The red, green, blue, and black solid lines represent linear fits to the color-mass relations weighted with Pi(EASK0), Pi(EASK2), Pi(EASK3), and Pi(E), respectively. |
| In the text | |
|
Fig. 7 Effective r-band radius (re) as a function of stellar mass for galaxies in the SDSS DR7 spectroscopic catalog (grey scale). The colored regions show the location of galaxies with Pi(EASK0) > 0.5 (red), Pi(EASK2) > 0.5 (green), and Pi(EASK3) > 0.5 (blue). The solid lines show the best linear weighted fits to the relations (see Fig. 6 for the color code of these lines). |
| In the text | |
|
Fig. 8 Fundamental plane of all galaxies from the SDSS-DR7 spectroscopic catalog (grey scale). The colored regions show the location of galaxies with Pi(EASK0) > 0.5 (red), Pi(EASK2) > 0.5 (green), and Pi(EASK3) > 0.5 (blue). The continuous lines show the best linear weighted fits to the relations (colors of the solid lines as in Fig. 6). |
| In the text | |
|
Fig. 9 The Faber-Jackson relationship for the galaxies in the SDSS-DR7 spectroscopic catalog (grey scale). The colored regions show the location of galaxies with Pi(EASK0) > 0.5 (red), Pi(EASK2) > 0.5 (green), and Pi(EASK3) > 0.5 (blue). The solid lines correspond to the best linear weighted fits to the relations (colors of the solid lines as in Fig. 6). |
| In the text | |
|
Fig. 10 Mass fraction of EASK0 (red points), EASK2 (green points), and EASK3 (blue points) galaxies in each stellar mass bin. |
| In the text | |
|
Fig. 11 Top row: mean star formation history (left pannel) and metallicities (right pannel) for galaxies of types EASK0 (red), EASK2 (green), and EASK3 (blue). Bottom row: differences of the SFH (left panel) and metallicities (right panel) from those of EASK2 galaxies. |
| In the text | |
|
Fig. 12 Cumulative distribution function of the galaxy density of the EASK0 (red), EASK2 (green), and EASK3 (blue) galaxies in the sample of Nair & Abraham (2010). |
| In the text | |
|
Fig. 13 Hβ versus [MgFe]′ of the galaxies from SDSS-DR7 (grey scale). The asterisks show the mean values of the two indices for EASK0 (red), EASK2 (green), and EASK3 (blue) galaxies. |
| In the text | |
|
Fig. A.1 Effective r-band radius from Simard et al. (2011) as a function of stellar mass for galaxies in the SDSS DR7 spectroscopic catalog (grey scale). The colors and lines are as in Fig. 7. |
| In the text | |
|
Fig. A.2 Fundamental plane of the galaxies from SDSS-DR7 spectrosocpic catalog (grey color) using the effective radius given by Simard et al. (2011). The colors and lines are as in Fig. 8. |
| In the text | |
|
Fig. A.3 The Faber-Jackson relation of the galaxies from SDSS-DR7 spectrosocpic catalog (grey color) using the effective radius given by Simard et al. (2011). The colors and lines are as in Fig. 9. |
| In the text | |
Current usage metrics show cumulative count of Article Views (full-text article views including HTML views, PDF and ePub downloads, according to the available data) and Abstracts Views on Vision4Press platform.
Data correspond to usage on the plateform after 2015. The current usage metrics is available 48-96 hours after online publication and is updated daily on week days.
Initial download of the metrics may take a while.