Fig. 3
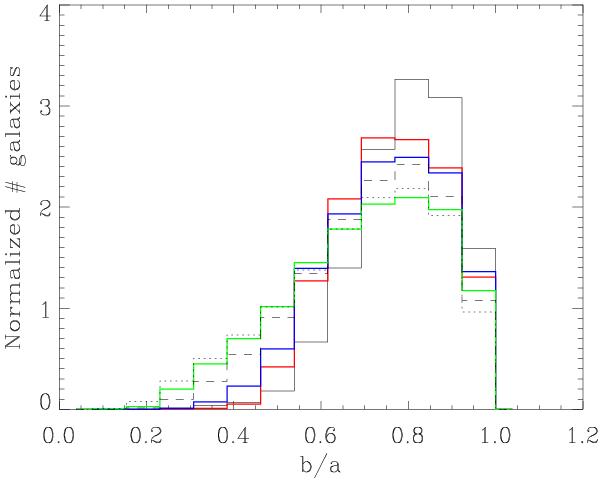
Axial ratio distribution of elliptical galaxies as computed in this work (black full line). The axial ratio distributions of galaxies visually classified by Nair & Abraham (2010) as elliptical (red line), elliptical + S0 (blue line), and elliptical + S0+Sab (green line) are also overplotted. The dashed and dotted lines represent the axial ratios of early-type galaxies from Bernardi et al. (2003) and Strateva et al. (2001), respectively. All histograms have been normalized to the same area.
Current usage metrics show cumulative count of Article Views (full-text article views including HTML views, PDF and ePub downloads, according to the available data) and Abstracts Views on Vision4Press platform.
Data correspond to usage on the plateform after 2015. The current usage metrics is available 48-96 hours after online publication and is updated daily on week days.
Initial download of the metrics may take a while.