| Issue |
A&A
Volume 540, April 2012
|
|
|---|---|---|
| Article Number | A136 | |
| Number of page(s) | 14 | |
| Section | Extragalactic astronomy | |
| DOI | https://doi.org/10.1051/0004-6361/201117632 | |
| Published online | 12 April 2012 | |
Online material
Appendix A: Dependence of the results on the effective radius measurements
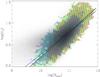 |
Fig. A.1
Effective r-band radius from Simard et al. (2011) as a function of stellar mass for galaxies in the SDSS DR7 spectroscopic catalog (grey scale). The colors and lines are as in Fig. 7. |
| Open with DEXTER | |
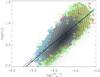 |
Fig. A.2
Fundamental plane of the galaxies from SDSS-DR7 spectrosocpic catalog (grey color) using the effective radius given by Simard et al. (2011). The colors and lines are as in Fig. 8. |
| Open with DEXTER | |
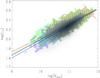 |
Fig. A.3
The Faber-Jackson relation of the galaxies from SDSS-DR7 spectrosocpic catalog (grey color) using the effective radius given by Simard et al. (2011). The colors and lines are as in Fig. 9. |
| Open with DEXTER | |
We defined the effective radius of the galaxies to be the radius containing 50% of the total Petrosian galaxy luminosity. This radius is not corrected for seeing, which may affect the scaling relations presented in this work. We estimated this influence by measuring the mass-size relation of our elliptical galaxies using the effective radius given by Simard et al. (2011). This different estimate was obtained by fitting the surface brightness distribution of the SDSS-DR7 galaxies with Sérsic models (see Simard et al. 2011). These models provide structural parameters of the galaxies after seeing corrections. We studied the influence of the used effective radius on the size-mass, fundamental plane, and Faber-Jackson relations, i.e., the relations involving re.
Figure A.1 shows the mass-size relations of EASK0, EASK2, and EASK3 galaxies computed in Sect. 3.2, but using the effective radius given by Simard et al. (2011). The fits of the
size-mass relations showed in Fig. A.1 are given in Table A.1. We note that the relations obtained here are consistent with those obtained in Sect. 3.2. In particular, for a given stellar mass, galaxies from the EASK3 class are also larger.
Figure A.2 shows the fundamental plane (FP) of EASK0, EASK2, and EASK3 galaxies computed using the effective radius measured by Simard et al. (2011). The fits to these FPs are shown in Table A.1. Notice that the behavior is similar to that reported in Sect. 3.3. In particular, all classes have FPs with a non-zero tilt, which is steeper for EASK3 galaxies. In this case, the tilts of the FPs are closer to the virial plane (b = 1) than those reported in Sect. 3.3.
Figure A.3 and Table A.1 show the Faber-Jackson relations of EASK0, EASK2, and EASK3 galaxies derived using the effective radius of the galaxies from Simard et al. (2011). In this case, the behavior and fits to the relations are the same as those reported in Sect. 3.4.
We can conclude that the results inferred from the scaling relationships of EASK0, EASK2, and EASK3 galaxies do not depend on the way the effective radius is measured.
Coefficients of linear fits to the size-mass, Faber-Jackson and FP relations of EASK0, EASK2, and EASK3 galaxies, and for all galaxies combined, using the effective radii corrected for seeing by Simard et al. (2011).
© ESO, 2012
Current usage metrics show cumulative count of Article Views (full-text article views including HTML views, PDF and ePub downloads, according to the available data) and Abstracts Views on Vision4Press platform.
Data correspond to usage on the plateform after 2015. The current usage metrics is available 48-96 hours after online publication and is updated daily on week days.
Initial download of the metrics may take a while.