Fig. 6
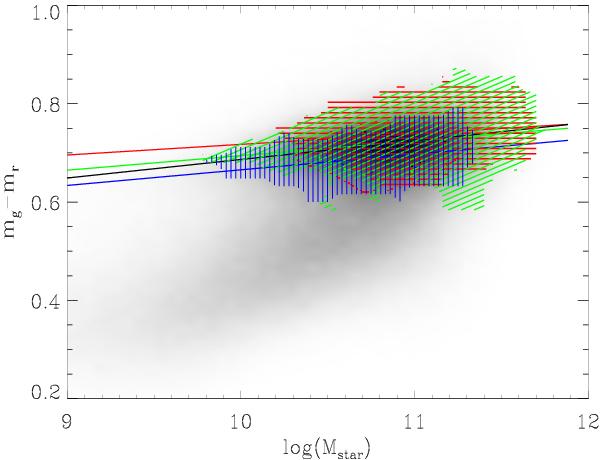
Color-mass diagram of the galaxies from SDSS-DR7 spectroscopic sample (grey scale). Colored regions show the location of galaxies with Pi(EASK0) > 0.5 (red), Pi(EASK2) > 0.5 (green), and Pi(EASK3) > 0.5 (blue). The red, green, blue, and black solid lines represent linear fits to the color-mass relations weighted with Pi(EASK0), Pi(EASK2), Pi(EASK3), and Pi(E), respectively.
Current usage metrics show cumulative count of Article Views (full-text article views including HTML views, PDF and ePub downloads, according to the available data) and Abstracts Views on Vision4Press platform.
Data correspond to usage on the plateform after 2015. The current usage metrics is available 48-96 hours after online publication and is updated daily on week days.
Initial download of the metrics may take a while.