| Issue |
A&A
Volume 539, March 2012
|
|
|---|---|---|
| Article Number | A45 | |
| Number of page(s) | 9 | |
| Section | Extragalactic astronomy | |
| DOI | https://doi.org/10.1051/0004-6361/201117900 | |
| Published online | 23 February 2012 | |
Galaxy interactions
I. Major and minor mergers
1 Consejo Nacional de Investigaciones Científicas y Técnicas, Argentina
e-mail: dgl@mail.oac.uncor.edu
2 ICATE, CONICET, CC 49, 5400 San Juan, Argentina
3 IATE, CONICET, OAC, Universidad Nacional de Córdoba, Laprida 854, X5000BGR, Córdoba, Argentina
4 Departamento de Astronomia, Instituto de Astronomia, Geofísica e Ciências Atmosféricas da USP, Rua do Matão 1226, Cidade Universitária, 05508-090, São Paulo, Brazil
Received: 17 August 2011
Accepted: 29 November 2011
Aims. We study galaxy pair samples selected from the Sloan Digital Sky Survey (SDSS-DR7) and we perform an analysis of minor and major mergers with the aim of investigating the dependence of galaxy properties on interactions.
Methods. We build a galaxy pair catalog requiring rp < 25 kpc h-1 and ΔV < 350 km s-1 within redshift z < 0.1. By visual inspection of SDSS images we remove false identifications and we classify the interactions into three categories: pairs undergoing merging, M; pairs with evident tidal features, T; and non disturbed, N. We also divide the pair sample into minor and major interactions according to the luminosity ratio of the galaxy members. We study star formation activity through colors, the 4000 Å break, and star formation rates.
Results. We find that ~10% of the pairs are classified as M. These systems show an excess of young stellar populations as inferred from the Dn(4000) spectral index, colors, and star formation rates of the member galaxies, an effect which we argue is directly related to the ongoing merging process. We find ~30% of the pairs exhibiting tidal features (T pairs) with member galaxies showing evidence of old stellar populations. This can be associated either to the disruptive effect of some tidal interactions, or to the longer time-scale of morphological disturbance with respect to the bursts of the tidal induced star formation. Regardless of the color distribution, we find a prominent blue peak in the strongest mergers, while pairs with tidal signs under a minor merger show a strong red peak. Therefore, our results show that galaxy interactions are important in driving the evolution of galaxy bimodality. By adding stellar masses and star formation rates of the two members of the pairs, we explore the global efficiency of star formation of the pairs as a whole. We find that, at a given total stellar mass, major mergers are significantly more efficient (a factor ≈ 2) in forming new stars, with respect to both minor mergers or a control sample of non-interacting galaxies.
We conclude that the characteristics of the interactions and the ratio of luminosity galaxy pair members involved in a merger are important parameters in setting galaxy properties.
Key words: galaxies: evolution / galaxies: interactions / galaxies: formation / galaxies: statistics / galaxies: starburst / galaxies: star formation
© ESO, 2012
1. Introduction
Over the history of the universe, galaxy-galaxy interactions link the process of star formation with the growth of galaxies. According to hierarchical structure formation models, these interactions play a critical role in the formation and evolution of galaxies as discussed by Woods et al. (2007, and references therein). Simulations show that galaxies grow by accreting other galaxies, mostly minor companions. Although collision of comparable galaxies are expected to be the most damaging, encounters between galaxies and minor companions should be the most common type of interaction because of the greater fractional abundance of low luminosity galaxies.
Analysis of observational data have also shown that galaxy interactions are powerful mechanisms to trigger star formation (Yee & Ellingson 1995; Kennicutt 1998). Barton et al. (2000) and Lambas et al. (2003) have carried out statistical analysis of star formation activity of galaxy pairs, finding that proximity in radial velocity and projected distance is correlated to an increase of the star formation activity.
The underling physics of star formation activity during galaxy-galaxy interactions have been explained by both theoretical (Martinet 1995), and numerical analysis (e.g. Toomre & Toomre 1972; Barnes & Hernquist 1992, 1996; Mihos & Hernquist 1996). These studies showed that starbursts are fueled by gas inflows produced by the tidal torques generating during the encounters. The efficiency of this mechanism depends on the particular internal characteristics of galaxies and their gas reservoir. In pairs with similar luminosity galaxies (i.e. major interactions) there is an important redistribution of mass and a strong gravitational tidal torque causing gas angular momentum to be transferred outwards before the final merger. In pairs formed by two galaxies with a large relative luminosity ratio (i.e. minor interactions) the tidal action from the less massive companions can induce a non-axisymmetric structure in the disk of the main galaxy (Hernquist & Mihos 1995). The star formation activity in minor interactions depend on structural and orbital parameters. Close passage, prograde orbits between bulge-less galaxies are the most efficient at inducing gas inflows, and therefore trigger the star formation (Cox 2009).
On the observational side, Woods et al. (2006) analyzed a sample of 136 pairs from the CfA2 Redshift Survey. The authors find that the relative luminosity of the companion galaxy is a determinant parameter of the star formation activity induced by the tidal effects of the interaction. Also, Woods & Geller (2007) found that, in minor pairs, the faint galaxy member shows evidence for tidally triggered star formation, whereas the primary galaxy is in general not strongly affected by the interaction. On the other hand, both galaxies undergoing a major interaction show enhanced star formation. Michel-Dansac et al. (2008) studied the metallicity in a sample of galaxy pairs taken from SDSS-DR4, finding that, in minor interactions, the less massive galaxy member is systematically enriched, while interacting with a comparable stellar mass companion shows a systematic metallicity decrement with respect to galaxies in isolation. The authors argue that metal-rich starbursts triggered by a more massive component, and inflows of low metallicity gas induced by comparable or less massive companion galaxies are a natural explanation for these results. By studying the spectral index, Dn(4000), and star formation rates, SFR, Woods et al. (2010) showed the presence of bursts of star formation associated to major galaxy interactions, in particular, in very close pairs.
Patton et al. (2010) studied optical colors finding an important fraction of red galaxies in pairs, a somewhat expected result since their galaxy pair sample reside preferentially in higher density environments than non-paired galaxies. These authors also found clear signs of interaction-induced star formation in the blue galaxies of close pairs.
Robaina et al. (2009) studied the dependence of SFR on projected galaxy separation using COMBO-17 data finding that only 10% of the star formation at intermediate redshift is triggered directly by major mergers and interactions. More recently, Darg et al. (2010) present a catalog of 39 multiple-mergers at z < 0.1 from the merger catalog of the Galaxy Zoo project where the member objects have properties typical of elliptical galaxies.
In this paper we focus on a statistical analysis of close galaxy pairs defined as those with relative projected separation rp < 25 kpc h-1 and relative radial velocities ΔV < 350 km s-1. According to these prescriptions, we have constructed a catalog of close pairs from the SDSS-DR7 and following Alonso et al. (2007) these pairs were classified according to the level of morphological disturbance associated to the interaction. In an attempt to explore the physical mechanisms that may affect the star formation activity, we have analyzed galaxy luminosities, spectral indicators of stellar populations, and colors. We use K-corrections of the publicly available code described in Blanton & Roweis (2007) (k-correct_v4.2) as a calibration for our k-corrected magnitudes.
This paper is structured as follows: Sect. 2 describes the procedure used to construct the catalog and explain the process of classification and depuration of pair galaxies. In Sect. 3 we study and characterize the effects of major and minor interactions and we discuss the dependence of star formation on colors and stellar population age. In Sect. 4, we summarize our main conclusions.
2. Construction of a galaxy pair catalog from SDSS-DR7
The Sloan Digital Sky Survey (SDSS, York et al. 2000) is the largest galaxy survey at the present. It uses a 2.5 m telescope (Gunn et al. 2006) to obtain photometric and spectroscopy data that will cover approximately one-quarter of the celestial sphere and collect spectra of more than one million objects. The seven data release imaging (DR7, Abazajian et al. 2009) comprises 11663 square degrees of sky imaged in five wave-bands (u, g, r, i and z) containing photometric parameters of 357 million objects. Within the survey area, DR7 includes spectroscopic data covering 9380 square degrees with 929 555 spectra of galaxies. DR7 therefore represents the final data set released with the original targeting and galaxy selection (Eisenstein et al. 2001; Strauss et al. 2002). The main galaxy sample is essentially a magnitude limited spectroscopic sample (Petrosian magnitude) rlim < 17.77, most of galaxies span a redshift range 0 < z < 0.25 with a median redshift of 0.1 (Strauss et al. 2002). We considered a shorter redshift range, z < 0.1, in order to avoid strong incompleteness at larger distances (Alonso et al. 2006).
We build a Galaxy Pair Catalog (GPC) from the SDSS-DR7, following our previous works (Alonso et al. 2007), requiring members to have relative projected separations, rp < 25 kpc h-1 and relative radial velocities, ΔV < 350 km s-1 within redshifts z < 0.1. The number of pairs satisfying these criteria is 5579. We exclude AGNs for our sample, which could affect our interpretation of the results due to contributions from their emission line spectral features. We have also removed false identifications (mostly parts of the same galaxy) and objects with large magnitude uncertainties. With these restrictions, our final pair catalog in the SDSS-DR7 comprises 1959 reliable close galaxy pairs with z < 0.1. In Table 1 we summarize this results. As discussed in Alonso et al. (2006), the effects of incompleteness or aperture (e.g see also Balogh et al. 2004) do not introduce important bias in the galaxy pair catalogs.
Percentages of different galaxy pair types.
2.1. Classification of galaxy pairs
We classified all galaxies in the pair catalog taking into account the eye-ball detection of features characteristics of interactions, using the photometric SDSS-DR7. We defined two categories: disturbed and non disturbed pairs. Disturbed pairs are sub-classified as merging (M, pairs with evidence of an ongoing merging process) and tidal (T, pairs with signs of tidal interactions but not necessarily merging). Non disturbed (N) pairs showing no evidence of distorted morphologies. Figure 1 shows images of typical examples of pair galaxies for different visual classification: M, T and N. For the pair catalog we calculate the percentage of these three categories defined above. As we can notice from Table 2, we find that about 10% of galaxy pairs are classified as M, 30% as T and 60% as N, these percentages do not depend on redshift.
The visual inspection was performed by one of the authors in order to maintain a unified criteria. The reliability of the classification was addressed by the comparison with the classification of a subsample of pairs by another author. This procedure allows us to quantify the uncertainty in the classification (see Table 2).
We show in Fig. 2 the z, Mr and log (Σ5)1 distributions (upper, medium and lower panels, respectively) for M, T and N systems (solid, dashed and dot-dashed lines, respectively). It can be appreciated that the galaxies of the different pair interaction categories show similar redshift trends. The middle panel show that the luminosity distributions of the three interaction categories are comparable albeit with a small trend for higher luminosities in the M and T samples. The lower panel shows that the log(Σ5) distributions of M, T and N pairs are remarkably similar. This provides an important result regarding the local environment of galaxies undergoing merger process in the present universe.
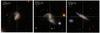 |
Fig. 1 Examples of galaxy pair images with different classification: M (left panel), z = 0.060; T (medium panel), z = 0.027 and N, z = 0.023 (right panel); the scale, size in arcsec and the N-E direction can be seen in figure. |
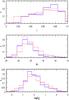 |
Fig. 2 Distribution of z, Mr and log(Σ5) (upper, medium and lower panels, respectively) for pair galaxies classified as M, T and N (solid, dashed and dot-dashed lines, respectively). |
Percentages of pairs classified as M, T and N.
2.1.1. Dependence on rp and ΔV
In this subsection we analyze the dependence of pair classification on projected distances, rp, and relative velocities, ΔV, between members. For this purpose, we show in Fig. 3 density contours in the rp − ΔV plane for galaxies of the different interaction classes, M, T and N. The gray scale correspond to different percentages of pairs enclosed in a given contour.
As expected, given that the classification is based on visual appearance in projection, there is a trend for lower rp values for M and T types. Nevertheless, the classification cannot be reduced to a relative distance criterion and therefore a visual inspection of images is required to detect the interaction-driven morphological disturbances. We find that the distribution of relative radial velocities is significantly lower in M types as compared to T and N types.
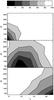 |
Fig. 3 Distribution of projected separation, rp, and relative radial velocity, ΔV, for M, T and N pairs (upper, medium and lower panels, respectively). The gray scale show the different percentages of enclosed pairs in a given contour. |
2.1.2. Comparison with the Galaxy Zoo Catalog
We cross-correlate our sample of galaxy pairs with the galaxy zoo catalog (Lintott et al. 2011) to compare the two classification schemes. Galaxy Zoo comprises a morphological classification of nearly 900 000 galaxies drawn from the Sloan Digital Sky Survey, contributed by hundreds of thousands of volunteers in order to cover a wide coverage of the galaxy survey, however due to the large number of classifiers it becomes complex to maintain a unified criteria and a reliable classification. They define six categories (elliptical, spiral, spiral clockwise, spiral anticlockwise, merger or uncertain) and give the fraction of votes in each of the six categories. Objects classified as mergers are identified as galaxies with signs of collision. We find 1417 common pairs in the two catalogs, where 596 pairs are classified as disturbed (M or T), while only 128 objects were classified as “merger” by the galaxy zoo team (fraction of votes > 0.5).
We show in Fig. 4 some typical examples of pairs we classified as M and T, while galaxy zoo assigned an extremely low fraction of votes for a “merger” in these objects.
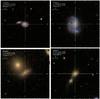 |
Fig. 4 Examples of pairs classified as M or T. For these galaxies, galaxy zoo provides a low fraction of votes for “merger”. The figure shows the scale, size in arcsec and the N-E direction. |
3. Major and minor interactions
It is expected that the effects of an interacting companion on a given object will strongly depend on their relative luminosity (mass proxy) ratio. For this reason, in this section we explore the dependence on the luminosity ratio of the interaction-induced star formation activity and colors. This analysis may help to deepen our understanding of this issue which has been explored by different authors under diverse approaches.
Observational evidence (e.g. Donzelli & Pastoriza 1997) shows that the faint members of an interacting pair are more strongly affected by the companion. Nevertheless, in a previous work (Lambas et al. 2003), using a detailed statistical analysis on 2dF Galaxy Redshift Survey (2dFGRS, Colles et al. 2001) data, showed that the brightest component of a pair has the most enhanced star formation activity when compared to isolated galaxies of similar luminosity, suggesting that interactions may effectively trigger star formation on the brighter member pairs. Ellison et al. (2008) found an enhancement of the SFR of galaxy pairs at projected separations <30−40 kpc h-1, an effect that is stronger in major mergers. More recently, Ellison et al. (2010) also found that both, the median mass ratio of pairs and the fraction of major-to-minor pairs, are independent of local environment.
In a similar way, Alonso et al. (2010), showed that galaxies with high stellar mass, low metallicity content and disturbed morphologies (characteristics of merger remnants) have bluer colors and younger stellar populations. These results would indicate that a close minor companion can induce significant inflows of external gas onto the central region which would lower the metallicity and trigger star formation in the most massive, morphologically disturbed galaxies.
For the present analysis we have divided our sample in major and minor interaction pairs according to the luminosity ratio of the galaxy members, the usually adopted criterion for the classification into major or minor interaction. In Fig. 5 (a) we show the distribution of the L2/L1 ratio, and the adopted threshold L2/L1 = 0.33 which gives 877 minor and 1082 major interactions.
The luminosity distributions of the galaxy members of these subsamples of pairs are shown in Fig. 5 (b and c) and in Fig. 6 we show some examples of major and minor galaxy encounters. Table 3 shows the percentages of pairs classified as M, T and N in minor and major interactions where it can be seen their similarity regardless the relative luminosity ratio.
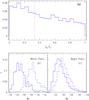 |
Fig. 5 a) Distribution of the luminosity ratios of galaxies in the pair sample. b) and c) show the Mr distributions of the most luminous (solid lines) and less luminous (dashed lines) galaxy member in minor and major pair subsamples, respectively. |
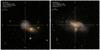 |
Fig. 6 Examples of major and minor interactions. Major interaction (left) with z = 0.075 and L2/L1 = 0.14; minor interaction (right) with z = 0.041 and L2/L1 = 0.51. The figure shows the scale, size in arcsec and the N-E direction. |
Following Sect. 2.1.1, we performed the same analysis of the dependence of pair classification on projected distances, rp, and relative velocities, ΔV, for the subsamples of major and minor pairs. We show in Fig. 7 density contours in the rp − ΔV plane for galaxies of the different interaction classes, M, T and N, in major and minor interactions (left and right panels, respectively). The gray scale correspond to different percentages of pairs enclosed in a given contour. It can be observed in this figure similar results as in Fig. 3, indicating that the trends do not depend on the luminosity ratio of the galaxies.
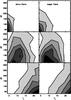 |
Fig. 7 Distribution of projected separation, rp, and relative radial velocity, ΔV, for M, T and N pairs (upper, medium and lower panels, respectively), in minor (left) and major (right) pairs. The grey scale show the different percentages of enclosed pairs in a given contour (17%, 33%, 50%, 66% and 83%). |
3.1. Galaxy colors
In order to explore the effects of galaxy interactions on the color index of the pair members, in Fig. 8 we show the (u − r) color distributions of galaxies in major and minor interactions, indicating separately the bright and faint components in the minor interactions (upper and medium panels respectively). Since the two galaxy members in major pairs have similar luminosity (see Fig. 5), the division in this case is not important.
It can be seen that there is an excess of galaxies in the blue peak in M systems. In particular, the faint members of minor interaction pair show a significant fraction of galaxies with extremely blue colors (u − r < 1). Similar results were obtained by Woods & Geller (2007), who found that the faint members in minor pairs show enhanced star formation activity.
On the other hand, T pairs show an excess of galaxies in the red peak as compared to N-types.
The absence of an intermediate color population indicates that the process responsible for the transformation from blue to red colors needs to be very fast and efficient (e.g. Baldry et al. 2004; Balogh et al. 2004). In this context, our results suggest that the variation of the blue and red peak locations of the color bimodal distribution could be driven by different aspects of galaxy interactions such as evolutionary stage, gas content, interaction strength, etc.
Percentages of pairs classified as M, T and N, in minor and major interaction pairs.
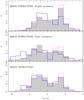 |
Fig. 8 Distribution of u − r colors for the brightest and faintest pair members in minor interactions (upper and medium panels, respectively). Solid lines, dashed lines and full surface correspond to M, T and N pairs respectively. The lower panel correspond to major interactions. |
3.2. Galaxy 4000 Å discontinuity
In the following analysis we use the spectral index Dn(4000), as an indicator of the age of stellar populations. This spectral discontinuity occurring at 4000 Å (Kauffmann et al. 2003) arises by an accumulation of a large number of spectral lines in a narrow region of the spectrum, an effect that is important in the spectra of old stars. We have adopted Balogh et al. (1999) definition of Dn(4000) as the ratio of the average flux densities in the narrow continuum bands (3850–3950 ? and 4000–4100 ?).
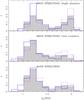 |
Fig. 9 Distribution of Dn(4000) for the brightest and faintest galaxy members in minor pairs, upper and medium panels respectively. Solid and dashed lines correspond to M and T types respectively, full surface correspond to N types. In the lower panel we show the corresponding distributions for major interactions. |
In Fig. 9 we show the distribution of Dn(4000) values for galaxies in M, T and N types. We also separate in this figure the results for the brightest and the faintest members in minor interactions. In agreement with the previous results for colors, we find an excess of M types exhibiting low values of Dn(4000) showing that galaxies undergoing strong interactions are dominated by young stellar populations, in agreement with Woods et al. (2010).
We also find evidence that T pairs have an excess of large Dn(4000) values, characteristic of old stellar populations.
Possible explanations for the fact that pairs with tidal features have a higher fraction of old stellar populations (reflected by both u − r and Dn(4000) distributions) can be related to the longer timescale of morphological disturbance with respect to that of the tidally induced star formation. Thus, these pairs may have an aged (reddened) stellar population and still present strong signs of a past interaction. Besides, it can be argued that strong tidal features can be associated to disruptive effects present in some tidal interactions of galaxy disks which would lead to lower gas densities and therefore lower star formation rates in these systems.
In order to provide a suitable quantification of the effects of strong interactions on the relative fraction of star-forming galaxies at a given luminosity we have considered a single threshold in Dn(4000) = 1.5 to divide the sample into star-forming and passive galaxies. For comparison, we also construct a control sample for the pair catalog, defined by galaxies without a close companion within the adopted separation and velocity thresholds. By using a Monte Carlo algorithm, for each galaxy pair, we selected two other galaxies without a companion within rp < 100 kpc h-1 and relative radial velocities, ΔV < 350 km s-1. Moreover, these galaxies were also required to match the observed redshift, luminosity and local density environment, Σ5, distributions of the corresponding pair sample, to represent a robust control sample (Perez et al. 2009). In Fig. 10 we show the redshift, Mr and log(Σ5) distributions (upper, medium and lower panels, respectively) for pair galaxy catalog (dashed lines) and their corresponding control sample (solid lines). We have also explored these distributions with the restriction Dn(4000) < 1.5 in both pair and control samples, finding similar distributions of redshift, luminosity, and local density environment. Taking into account this result, we conclude that this set of control galaxies is suitable for our purpose. Furthermore, we have also built a second test sample of close galaxies in projection (rp < 30 kpc h-1), but with a large redshift difference (ΔV > 2000 km s-1). We find that this sample of unphysical pairs behaves remarkably similar to the control sample in the different analysis performed. This gives another indication for the reliability of the control sample and that the spatial proximity is a crucial parameter that determines the behavior of pair galaxies.
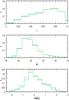 |
Fig. 10 Distribution of z, Mr and log(Σ5) in pair galaxies (dashed lines) and in the control sample (solid lines). |
In Fig. 11 we show the fraction of star-forming galaxies, Dn(4000) < 1.5, as a function of Mr in M and T types relative to the control sample (fraction (Dn(4000) < 1.5(M/T))/fraction (Dn(4000) < 1.5(Control))). In this figure we distinguish the brightest and faintest members in minor interactions (upper and medium panels, respectively), the lower panel correspond to major interactions. We find that for the more luminous systems the effects of interactions in M pairs are strongest (by a factor ≈ 2) in terms of the relative fraction of star-forming galaxies. In close galaxy pairs Ellison et al. (2008, 2010) and Woods & Geller (2007) show similar trends. However, in T pairs, there is an opposite trend, with lower amplitude.
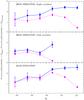 |
Fig. 11 The fraction of galaxies with Dn(4000) < 1.5 relative to the control sample, fraction (Dn(4000) < 1.5(M/T))/fraction (Dn(4000) < 1.5(Control)), as a function of Mr, for the brightest and the faintest pair members in minor interactions, upper and medium panels respectively. Solid and dashed lines correspond to M and T types, respectively. In the lower panel we show the corresponding distributions for major interactions. The errors shown were calculated within uncertainties derived through the bootstrap re-sampling technique. |
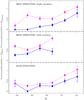 |
Fig. 12 The fraction of galaxies with Dn(4000) > 1.5 relative to the control sample, fraction (Dn(4000) > 1.5(M/T))/fraction (Dn(4000) > 1.5(Control)), as a function of Mr, for the brightest and the faintest pair members in minor interactions, upper and medium panels respectively. Solid and dashed lines correspond to M and T types, respectively. In the lower panel we show the corresponding distributions for major interactions. The errors shown were calculated within uncertainties derived through the bootstrap re-sampling technique. |
We have also explored the dependence of the fraction of the old stellar population in galaxies of M and T types, (solid and dashed lines, respectively), relative to the control sample (fraction (Dn(4000) > 1.5(M/T))/fraction (Dn(4000) > 1.5(Control)) as a function of Mr. Figure 12 shows an equivalent set of plots to those of the young stellar population fractions displayed in Fig. 11, also considering separately major interactions, and the brightest and faintest members in minor interactions. It can be seen in Fig. 12 an increase of the old stellar population fraction in luminous systems and that the effects of interactions in T pairs are strongest. This provides further support to our hypothesis of disruptive effects of some interactions that could lead to both, our classification into the T class, and an associated larger fraction of old stellar populations provided by a shutdown of the provision of gas to form new stars.
3.3. Global star formation efficiency in major and minor interactions
Since interacting galaxies may finally end in a single system, in this subsection we analyze the efficiency of interactions to trigger the formation of stars in the pair considered as a whole.
For this aim, we compute the sum of the stellar masses and the sum of the star formation rates for the two members of a given pair using the data given in Brinchman et al. (2004). Fig. 13 shows the behavior of the total star formation rate (SFR1 + SFR2) as a function of the total stellar mass ( ). It is clearly seen by comparison of the upper and lower panels that in both, minor and major interactions, pairs with tidal signatures (M and T pairs) have a significantly higher total star formation rate than N pairs. The comparison with a control sample shows that interactions show enhanced star formation activities. It can also be appreciated that, at a given total stellar mass and irrespective of the morphological appearance of the interacting pairs, major interactions are those more efficient in forming new stars (up to a factor 2).
In a similar way, we performed an analysis computing the global index colors as a function of a total stellar mass. The results are displayed in Fig. 14. It can be seen that galaxies in disturbed pairs (upper panel) show bluer colors than non-disturbed systems (lower panel), at a given total stellar mass; and we have also noted that major mergers show a significant bluer population. Also, galaxies in the control sample are redder than galaxies in different interaction classes (minor/major mergers, disturbed/non-disturbed pairs), indicating that the global efficiency of different stages/classes of interactions are associated with triggered star formation activity, reflected in the blue colors.
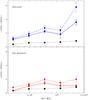 |
Fig. 13 Total star formation rate ⟨ SFR1 + SFR2 ⟩ as a function of total stellar mass |
4. Summary and conclusions
We have performed a statistical analysis of 1959 galaxy pairs (rp < 25 kpc h-1 and ΔV < 350 km s-1) within z < 0.1 selected from SDSS-DR7 and we have carried out an eye-ball classification of images according to the evidence of interaction through distorted morphologies and tidal features.
We can summarize the main results in the following conclusions.
-
We classified 10% of the total pair sample as merging, 30% with tidal features, and 60% as non disturbed. We also explore the relation between projected separation and relative radial velocity, showing that rp and ΔV ranges overlap for the different pair categories. This result indicates that neither relative distance nor radial velocity between pair members are enough to predict the interaction class assignment, so that visual inspection of images is required to properly classify galaxy interactions.
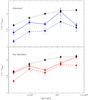
Fig. 14 Total ⟨ (u − r) ⟩ as a function of total stellar mass
 for major (dashed) and minor (solid) interactions classified as disturbed (M and T) and non-disturbed (N) (upper and lower panels, respectively). Dotted lines represents the control sample within uncertainties derived through the bootstrap re-sampling technique.
 We separate the pair galaxy catalog into minor and major mergers according to the relative luminosities of the galaxy members and consider galaxy colors. We find significant changes in the color distribution according to the relative luminosity of the pair members. We find that the bright and faint members in M minor interactions are bluer than those in T and N pairs. We notice that this tendency is more important in the faintest galaxy pair members. T systems show a large population of red galaxies with respect to N-types. Therefore, these results suggest that galaxy interactions are important in driving the evolution of galaxy color bimodality mainly through an induced inflow of gas forming new star generations and the effects of tidal disruption.
-
We have considered a single threshold in Dn(4000) = 1.5 to divide the sample into star-forming and passive galaxies. The Dn(4000) distributions also show an excess of young stellar population in M pairs, indicating recently triggered star formation events. In agreement with colors, we find that T pairs show a significant excess of old stellar populations. We find that the relative fraction of luminous star-forming galaxies in M pairs is higher by a factor ≈ 2 as compared to the control sample.
-
We have also performed an analysis of the pairs considered as a single system. We find that at a given total stellar mass, major interactions are more efficient in forming new stars in comparison to minor pairs (by a factor ≈ 2). Nevertheless, in both, minor and major interactions, disturbed pairs (M and T systems) have a significantly higher total star formation rate than non-disturbed galaxies. In a similar way, at a given total stellar mass, disturbed pairs show blue global color with respect to non-disturbed systems.
We conclude that galaxy interactions and mergers provide key mechanisms that regulate galaxy properties. We find that encounters of galaxies with similar luminosities are globally more effective in forming new stars, in comparison to minor mergers. We also show that this process is significantly more efficient in pairs with strong signs of interactions. Finally, we argue that the ratio between the luminosity of the galaxy members involved in a merger, and the characteristics of interactions are important issues in setting star formation activity, building the stellar populations and global galaxy colors.
Acknowledgments
This work was partially supported by the Consejo Nacional de Investigaciones Científicas y Técnicas and the Secretaría de Ciencia y Técnica de la Universidad Nacional de San Juan. Ana Laura O’Mill was supported by the Brazilian agencies FAPESP and CNPq. Funding for the SDSS has been provided by the Alfred P. Sloan Foundation, the Participating Institutions, the National Science Foundation, the U.S. Department of Energy, the National Aeronautics and Space Administration, the Japanese Monbukagakusho, the Max Planck Society, and the Higher Education Funding Council for England. The SDSS Web Site is http://www.sdss.org/. The SDSS is managed by the Astrophysical Research Consortium for the Participating Institutions. The Participating Institutions are the American Museum of Natural History, Astrophysical Institute Potsdam, University of Basel, University of Cambridge, Case Western Reserve University, University of Chicago, Drexel University, Fermilab, the Institute for Advanced Study, the Japan Participation Group, Johns Hopkins University, the Joint Institute for Nuclear Astrophysics, the Kavli Institute for Particle Astrophysics and Cosmology, the Korean Scientist Group, the Chinese Academy of Sciences (LAMOST), Los Alamos National Laboratory, the Max-Planck-Institute for Astronomy (MPIA), the Max-Planck-Institute for Astrophysics (MPA), New Mexico State University, Ohio State University, University of Pittsburgh, University of Portsmouth, Princeton University, the United States Naval Observatory, and the University of Washington. The authors thank Dr. Nelson Padilla for a detailed revision and useful comments.
References
- Abazajian, K. N., Adelman-McCarthy, J. K., Ageros, M. A., et al. 2009, ApJS, 182, 543 [NASA ADS] [CrossRef] [Google Scholar]
- Alonso, M. S., Lambas, D. G., Tissera, P., & Coldwell, G. 2006, MNRAS, 367, 1029 [NASA ADS] [CrossRef] [Google Scholar]
- Alonso, M. S., Lambas, D. G., Tissera, P., & Coldwell, G. 2007, MNRAS, 375, 1017 [NASA ADS] [CrossRef] [Google Scholar]
- Alonso, M. S., Michel-Dansac, L., & Lambas, D. G. 2010, A&A, 514, A57 [NASA ADS] [CrossRef] [EDP Sciences] [Google Scholar]
- Balogh, M., Morris, S. L., Yee, H. K. C., Carlberg, R. G., & Ellingson, E. 1999, ApJ, 527, 54 [NASA ADS] [CrossRef] [Google Scholar]
- Balogh, M., Eke, V., Miller, C., et al. 2004, MNRAS, 348, 1355 [Google Scholar]
- Baldry, I. K., Glazebrook, K., Brinkmann, J., et al. 2004, ApJ 600, 681 [Google Scholar]
- Baldry, I. K., Balogh, M. L., Bower, R. G., et al. 2006, MNRAS, 373, 469 [NASA ADS] [CrossRef] [Google Scholar]
- Barnes, J., & Hernquist, L. 1992, ARA&A, 30, 705 [NASA ADS] [CrossRef] [Google Scholar]
- Barnes, J., & Hernquist, L. 1996, ApJ, 471, 115 [NASA ADS] [CrossRef] [Google Scholar]
- Barton, E. J., Geller, M. J., & Kenyon, S. J. 2000, ApJ, 530, 660 [NASA ADS] [CrossRef] [Google Scholar]
- Blanton, M., & Roweis, S., AJ, 133, 734 [Google Scholar]
- Brinchmann, J., Chalot, S., White, S. D. M., et al. 2004, MNRAS, 351, 1151 [NASA ADS] [CrossRef] [Google Scholar]
- Colless, M. M., Dalton, G., Maddox, S., et al. 2001, MNRAS, 328, 1039 [NASA ADS] [CrossRef] [Google Scholar]
- Cox, T. J. 2009, ASPC, 419, 235C [NASA ADS] [Google Scholar]
- Darg, D. W., Kaviraj, S., Lintott, C. J., et al. 2010, MNRAS, 401, 1552 [NASA ADS] [CrossRef] [Google Scholar]
- Donzelli, C. J., & Pastoriza, M. G. 1997, ApJS, 111, 181 [NASA ADS] [CrossRef] [Google Scholar]
- Eisenstein, D. J., Annis, J., Gunn, J. E., et al. 2001, AJ, 122, 226 [Google Scholar]
- Ellison, S., Patton, D. R., Simard, L., & McConnachie, A. W. 2008, AJ, 135, 1877 [NASA ADS] [CrossRef] [Google Scholar]
- Ellison, S., Patton, D. R., Simard, L., et al. 2010, MNRAS, 407, 1514 [NASA ADS] [CrossRef] [Google Scholar]
- Gunn, J. E., Siegmund, W. A., Mannery, E. J., et al. 2006, AJ, 133, 2332 [NASA ADS] [CrossRef] [Google Scholar]
- Hernquist, L., & Mihos, J. C. 1995, ApJ, 448, 41 [NASA ADS] [CrossRef] [Google Scholar]
- Kauffmann, G. 2002, MNRAS, 264, 201 [Google Scholar]
- Kennicutt, R. 1998, ARA&A, 36, 189 [Google Scholar]
- Lambas, D. G., Tissera, P. B., Alonso, M. S., & Coldwell, G. 2003, MNRAS, 346, 1189 [NASA ADS] [CrossRef] [Google Scholar]
- Lintott, C., Schawinski, K., Bamford, S., et al. 2011, MNRAS, 410, 166L [NASA ADS] [CrossRef] [Google Scholar]
- Martinet, L. 1995, FCPh, 15, 341 [Google Scholar]
- Mihos, J. C., & Hernquist, L. 1996, ApJ, 464, 641 [NASA ADS] [CrossRef] [Google Scholar]
- Patton, D. R., Ellison, S. L., Simard, L., et al. 2011, MNRAS, 412, 591P [NASA ADS] [CrossRef] [Google Scholar]
- Perez, J., Tissera, P., Padilla, N., Alonso, M. S., & Lambas, G. D. 2009, MNRAS, 399, 1157 [NASA ADS] [CrossRef] [Google Scholar]
- Robaina, A. R., Bell, E. F., Skelton, R. E., et al. 2009, ApJ, 704, 324R [NASA ADS] [CrossRef] [Google Scholar]
- Strauss, A., Weinberg, D. H., Lupton, R. H., et al. 2002, AJ, 124, 1810 [NASA ADS] [CrossRef] [Google Scholar]
- Toomre, A., & Toomre, J. 1972, ApJ, 178, 623 [NASA ADS] [CrossRef] [Google Scholar]
- Woods, D., & Geller, M. 2007, AJ, 134, 527 [NASA ADS] [CrossRef] [Google Scholar]
- Woods, D., Geller, M., & Barton, E. 2006, AJ, 132, 209 [Google Scholar]
- Woods, D., Geller, M. J., Kurtz, M. J., et al. 2010, AJ, 139, 1857 [NASA ADS] [CrossRef] [Google Scholar]
- Yee, H. K. C., & Ellingson, E. 1995, ApJ, 445, 37 [Google Scholar]
- York, D. G., Adelman, J., Anderson, J. E., Jr., et al. 2000, AJ, 120, 1579 [Google Scholar]
All Tables
Percentages of pairs classified as M, T and N, in minor and major interaction pairs.
All Figures
|
Fig. 1 Examples of galaxy pair images with different classification: M (left panel), z = 0.060; T (medium panel), z = 0.027 and N, z = 0.023 (right panel); the scale, size in arcsec and the N-E direction can be seen in figure. |
| In the text | |
|
Fig. 2 Distribution of z, Mr and log(Σ5) (upper, medium and lower panels, respectively) for pair galaxies classified as M, T and N (solid, dashed and dot-dashed lines, respectively). |
| In the text | |
|
Fig. 3 Distribution of projected separation, rp, and relative radial velocity, ΔV, for M, T and N pairs (upper, medium and lower panels, respectively). The gray scale show the different percentages of enclosed pairs in a given contour. |
| In the text | |
|
Fig. 4 Examples of pairs classified as M or T. For these galaxies, galaxy zoo provides a low fraction of votes for “merger”. The figure shows the scale, size in arcsec and the N-E direction. |
| In the text | |
|
Fig. 5 a) Distribution of the luminosity ratios of galaxies in the pair sample. b) and c) show the Mr distributions of the most luminous (solid lines) and less luminous (dashed lines) galaxy member in minor and major pair subsamples, respectively. |
| In the text | |
|
Fig. 6 Examples of major and minor interactions. Major interaction (left) with z = 0.075 and L2/L1 = 0.14; minor interaction (right) with z = 0.041 and L2/L1 = 0.51. The figure shows the scale, size in arcsec and the N-E direction. |
| In the text | |
|
Fig. 7 Distribution of projected separation, rp, and relative radial velocity, ΔV, for M, T and N pairs (upper, medium and lower panels, respectively), in minor (left) and major (right) pairs. The grey scale show the different percentages of enclosed pairs in a given contour (17%, 33%, 50%, 66% and 83%). |
| In the text | |
|
Fig. 8 Distribution of u − r colors for the brightest and faintest pair members in minor interactions (upper and medium panels, respectively). Solid lines, dashed lines and full surface correspond to M, T and N pairs respectively. The lower panel correspond to major interactions. |
| In the text | |
|
Fig. 9 Distribution of Dn(4000) for the brightest and faintest galaxy members in minor pairs, upper and medium panels respectively. Solid and dashed lines correspond to M and T types respectively, full surface correspond to N types. In the lower panel we show the corresponding distributions for major interactions. |
| In the text | |
|
Fig. 10 Distribution of z, Mr and log(Σ5) in pair galaxies (dashed lines) and in the control sample (solid lines). |
| In the text | |
|
Fig. 11 The fraction of galaxies with Dn(4000) < 1.5 relative to the control sample, fraction (Dn(4000) < 1.5(M/T))/fraction (Dn(4000) < 1.5(Control)), as a function of Mr, for the brightest and the faintest pair members in minor interactions, upper and medium panels respectively. Solid and dashed lines correspond to M and T types, respectively. In the lower panel we show the corresponding distributions for major interactions. The errors shown were calculated within uncertainties derived through the bootstrap re-sampling technique. |
| In the text | |
|
Fig. 12 The fraction of galaxies with Dn(4000) > 1.5 relative to the control sample, fraction (Dn(4000) > 1.5(M/T))/fraction (Dn(4000) > 1.5(Control)), as a function of Mr, for the brightest and the faintest pair members in minor interactions, upper and medium panels respectively. Solid and dashed lines correspond to M and T types, respectively. In the lower panel we show the corresponding distributions for major interactions. The errors shown were calculated within uncertainties derived through the bootstrap re-sampling technique. |
| In the text | |
|
Fig. 13 Total star formation rate ⟨ SFR1 + SFR2 ⟩ as a function of total stellar mass |
| In the text | |
|
Fig. 14 Total ⟨ (u − r) ⟩ as a function of total stellar mass |
| In the text | |
Current usage metrics show cumulative count of Article Views (full-text article views including HTML views, PDF and ePub downloads, according to the available data) and Abstracts Views on Vision4Press platform.
Data correspond to usage on the plateform after 2015. The current usage metrics is available 48-96 hours after online publication and is updated daily on week days.
Initial download of the metrics may take a while.