Free Access
Fig. 8
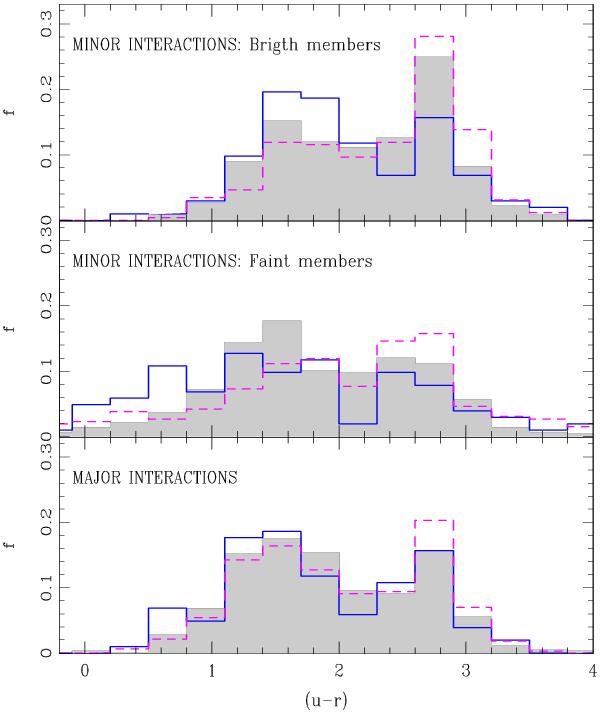
Distribution of u − r colors for the brightest and faintest pair members in minor interactions (upper and medium panels, respectively). Solid lines, dashed lines and full surface correspond to M, T and N pairs respectively. The lower panel correspond to major interactions.
Current usage metrics show cumulative count of Article Views (full-text article views including HTML views, PDF and ePub downloads, according to the available data) and Abstracts Views on Vision4Press platform.
Data correspond to usage on the plateform after 2015. The current usage metrics is available 48-96 hours after online publication and is updated daily on week days.
Initial download of the metrics may take a while.