Free Access
Fig. 5
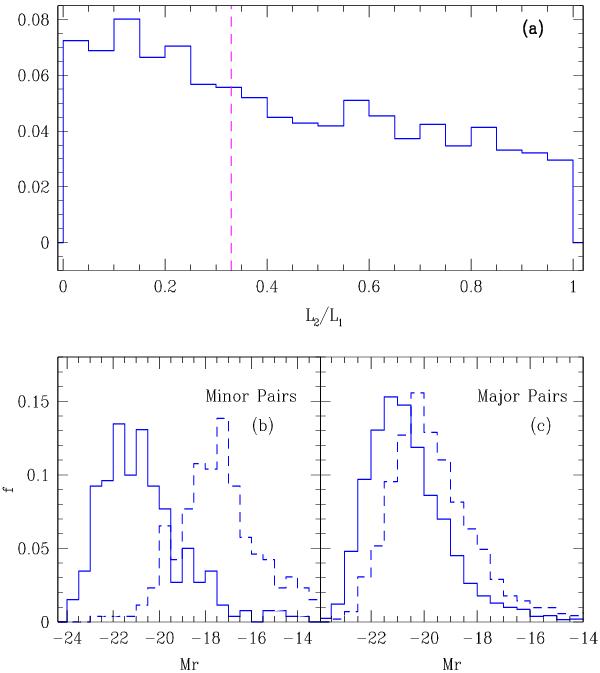
a) Distribution of the luminosity ratios of galaxies in the pair sample. b) and c) show the Mr distributions of the most luminous (solid lines) and less luminous (dashed lines) galaxy member in minor and major pair subsamples, respectively.
Current usage metrics show cumulative count of Article Views (full-text article views including HTML views, PDF and ePub downloads, according to the available data) and Abstracts Views on Vision4Press platform.
Data correspond to usage on the plateform after 2015. The current usage metrics is available 48-96 hours after online publication and is updated daily on week days.
Initial download of the metrics may take a while.