Fig. 12
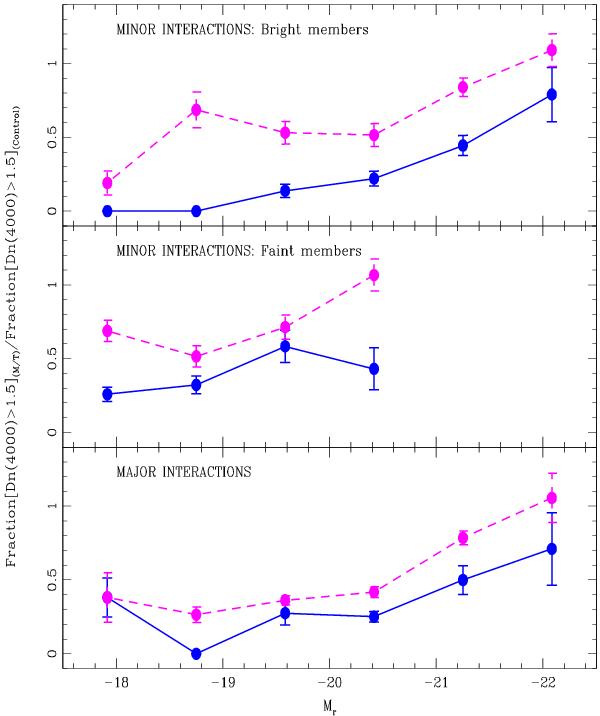
The fraction of galaxies with Dn(4000) > 1.5 relative to the control sample, fraction (Dn(4000) > 1.5(M/T))/fraction (Dn(4000) > 1.5(Control)), as a function of Mr, for the brightest and the faintest pair members in minor interactions, upper and medium panels respectively. Solid and dashed lines correspond to M and T types, respectively. In the lower panel we show the corresponding distributions for major interactions. The errors shown were calculated within uncertainties derived through the bootstrap re-sampling technique.
Current usage metrics show cumulative count of Article Views (full-text article views including HTML views, PDF and ePub downloads, according to the available data) and Abstracts Views on Vision4Press platform.
Data correspond to usage on the plateform after 2015. The current usage metrics is available 48-96 hours after online publication and is updated daily on week days.
Initial download of the metrics may take a while.