| Issue |
A&A
Volume 539, March 2012
|
|
|---|---|---|
| Article Number | A41 | |
| Number of page(s) | 4 | |
| Section | Planets and planetary systems | |
| DOI | https://doi.org/10.1051/0004-6361/201117659 | |
| Published online | 22 February 2012 | |
Research Note
Transition disks: four candidates for ongoing giant planet formation in Ophiuchus
1 Consejo Nacional de Investigaciones Científicas y Tećnicas
(CONICET), Argentina
e-mail: This email address is being protected from spambots. You need JavaScript enabled to view it.
2
Departamento de Física y Astronomía, Universidad de
Valparaíso, Av. Gran Bretaña
1111, Valparaíso,
Chile
3 Institute for Astronomy, University of Hawaii at Manoa,
Honolulu, HI 96822, Sagan Fellow
4 Herschel Science Centre, European Space Astronomy Centre
(ESA), PO Box 78, 28691 Villanueva de la Cañada ( Madrid), Spain
5
Harvard-Smithsonian Center for Astrophysics, 60 Garden St. MS 78,
Cambridge,
MA
02138,
USA
6
Instituto de Astronomía y Física del Espacio,
C.C. 67, Suc. 28,
(1428)
Buenos Aires,
Argentina
Received: 8 July 2011
Accepted: 21 November 2011
Abstract
Among the large set of Spitzer-selected transitional disks that we have examined in the Ophiuchus molecular, four disks have been identified as (giant) planet-forming candidates based on the morphology of their spectral energy distributions (SEDs), their apparent lack of stellar companions, and evidence of accretion. Here we characterize the structures of these disks modeling their optical, infrared, and (sub)millimeter SEDs. We use the Monte Carlo radiative transfer package RADMC to construct a parametric model of the dust distribution in a flared disk with an inner cavity and calculate the temperature structure that is consistent with the density profile, when the disk is in thermal equilibrium with the irradiating star. For each object, we conducted a Bayesian exploration of the parameter space generating Monte Carlo Markov chains (MCMC) that allow the identification of the best-fit model parameters and to constrain their range of statistical confidence. Our calculations imply that evacuated cavities with radii ~2–8 AU are present that appear to have been carved by embedded giant planets. We found parameter values that are consistent with those previously given in the literature, indicating that there has been a mild degree of grain growth and dust settling, which deserves to be investigated with further modeling and follow-up observations. Resolved images with (sub)millimeter interferometers would be required to break some of the degeneracies of the models and more tightly constrain the physical properties of these fascinating disks.
Key words: stars: pre-main sequence / protoplanetary disks / submillimeter: planetary systems
© ESO, 2012
1. Introduction
The infrared spectral energy distributions (SEDs) of circumstellar transitional disks reveal that they contain an optically thin inner region and an optically thick outer disk. Several mechanisms relevant to the overall evolution of circumstellar disks, and in particular to the short-lived phase when they dissipate, have been proposed to explain the so-called opacity holes of transition disks: giant planet formation, grain growth, photoevaporation, and tidal truncation in close binaries. We refer to Williams & Cieza (2011) for a review. The processes responsible for the inner holes of transition disks can tentatively be distinguished when disk masses, accretion rates, and multiplicity information are available (Najita et al. 2007; Cieza 2008). Following this approach, Cieza et al. (2010, hereafter Paper I) presented the initial results of an ongoing project to characterize a large set of transition disk candidates in nearby star-forming regions.
Probing the structure of disks that are suspected to be forming planets is the most promising approach to understanding the conditions in which planets are formed. The clearest indication of ongoing planet formation in disks is the detection of tidal gaps (e.g. Piétu et al. 2006) corresponding to a ring of significantly lower surface density (or the whole inner disk if it was depleted by accretion, e.g. Varneiére et al 2006). Spectacular confirmation was provided by the detection of the first potential substellar object within the gap of the transitional disk T Chamaleontis (Huélamo et al. 2011). Inner holes and gaps had been observed at (sub)millimeter wavelengths in a handful of objects bright enough for disk structure to be resolved (Piétu et al. 2006; Hughes et al. 2007, 2009; Brown et al. 2008, 2009; Andrews et al. 2009, 2010a, 2011; Isella et al. 2010a,b).
Comprehensive studies of similar transition disks are necessary to increase the empirical constraints on their structures and investigate their diversity. This is the primary motivation of this work, where we apply a parametric description to the four planet-forming disks candidates in Ophiuchus presented in Paper I and derive the best-fitting physical characteristics for their known SEDs.
2. The targets
In paper I, the observed SEDs were characterized by two parameters, which had been introduced by Cieza et al. (2007), namely the longest wavelength at which the observed flux is dominated by the stellar photosphere, λturn - off, and the slope of the IR excess, αexcess, computed between λturn - off and 24 μm. The former parameter correlates with the size of the inner hole, and the latter with the sharpness of the edge of the hole, i.e., a large increase in the dust density over a small range in radii is indicated by a positive αexcess. Accreting disks with sharp inner holes that seem to lack stellar companions (e.g., from adaptive optics imaging) represent the most promising candidates for ongoing (giant) planet formation.
Four cases fulfilled these criteria in Paper I from a sample of 26 of Spitzer-selected transitional disks in the Ophiuchus molecular cloud (d ~ 125 pc, Loinard et al. 2008). Their basic properties are listed in Table 1. The mass accretion rates for our targets, inferred from the Hα emission line widths (Natta et al. 2004), range from 1.3 × 10⁻¹⁰ to 5 × 10⁻⁸ M⊙/yr.
Target properties.
For all of them, we had at hand the photometric fluxes in the R-band from the USNO-B1 catalog, the J, H, and KS bands, from the Two Micron All Sky Survey (2MASS), as well as fluxes at 3.6, 4.5, 5.8, 8.0, 24, and 70 μm obtained by Spitzer1. We assumed errors that are within observational standards (≲20%) . In addition, all of our targets were observed with the Submillimeter Array (SMA). For two of them (Tran 21 and 32), we obtained the fluxes at 1.3 mm, while for Tran 11 and 31 we could only derive upper limits (see Paper I for details on SED data). For Tran 32, F850 μm was given in Nutter et al. (2006). One of our targets, Tran 11, was included in the study of cold disks (disks with large inner dust holes) performed by Merín et al (2010), i.e. their source # 24. It was modeled including a positive detection from MIPS photometry F70 μm = 537 ± 78.8 mJy, and the measured Spitzer-IRS spectrum, but has no constraints in its flux at (sub)-millimeter wavelengths. For the sake of completeness, we repeated the fit to the SED of this source with our set of free parameters and including the 1.3 mm flux upper limit.
3. Radiation transfer models
The modeling that we applied is similar to that performed by Andrews et al. (2009, 2010a) and Brown et al. (2009), who confirmed their physical estimates by completing a SED modeling based on direct imaging data. A two-dimensional structure model for flared disks was combined with the Monte Carlo continuum radiative transfer package RADMC v3.1 (Dullemond & Dominik 2004), which had been modified to include a density reduction as an inner cavity. The code computes a temperature structure consistent with the given density profile, and in equilibrium with the irradiation by the central star. The disk is presumed to be passive, an assumption that is supported by the low disk to stellar luminosity ratios of our sample, ≲0.005 according to estimates in Paper I.
We considered a surface density profile characterized by a power-law, Σ ∝ R−γ, with an exponential taper at larger radii (∝ e−(R/Rc)2−γ), where Rc is the characteristic radius. This was physically motivated by the success of similarity solutions of viscous disks in reproducing the observed gradual density decay at large radii (Hughes et al. 2008). The profile Σ was normalized to obtain the total mass of the disk, Md, when integrated. The radial index was fixed to be γ = 1, which is a typical value in the range γ = 0.4−1.1 established by Andrews et al (2010a). Our option could be questioned in the light of the results by Isella et al. (2009), who independently inferred slopes from steep to quite shallow in their sample of spatially resolved disks.
Resolved images would therefore be essential to obtain more accurate estimates of γ for our particular targets. We set the characteristic radius Rc = 100 AU. However, no spatially resolved information is available for the SEDs alone, and the data could be reproduced equally well with a wide range of outer disk values (Andrews et al. 2010b). The value we choose is representative of the disks with resolved interferometric visibilities, which are Rc = 14−198 AU (Andrews et al. 2009, 2010b) in Ophiuchus, and Rc ≃ 30−230 AU for Taurus-Auriga (Isella et al. 2009). We note that larger outer radii (100–1100 AU) were obtained with different fitting techniques (sharply truncated power-law fits to CO observations) that are not directly comparable with the Rc values (see Williams & Cieza 2011). Apart from the extreme case of a nearly edge-on viewing angle, the disk inclination cannot be determined from unresolved observations. Scattered light images have shown to be valuable in this sense (Pinte et al. 2007). We have set an intermediate representative inclination i = 30° in our modeling.
There is strong observational evidence that circumstellar dust can settlle onto the midplane (Furlan et al. 2006; McClure et al. 2010), which agrees with theoretical predictions (e.g., Dominik et al. 2007 and references). The growth of the dust grains, which proceeds in a complex fashion, can indeed be accelerated by dust settling, and the larger particles are expected to be aggregated close to the equatorial plane. The dust can therefore be distributed differently than the gas, which is expected to remain in hydrostatic equilibrium (Chiang & Goldreich 1997). This is described by a vertical Gaussian density profile with scale-height H and radial index ψ, i.e. H ∝ R1+ψ, anchored at R = 100 AU by H100. Vertically extended disks (with larger H) are heated more efficiently and thus reemit more radiation at mid- and far-IR wavelengths. Here we fixed ψ = 0.2 to reduce the number of free parameters of the models.
Following Andrews et al. (2009), we considered a radius, Rcav, such that the modified surface density is Σ′ = δcavΣ when R ≤ Rcav, and δcav < 1 artificially reduces the density inside the cavity, to mimic the deficit in the disk emission. The whole disk extends down to the distance, Rin, where the temperature is enough to sublimate the dust grains (~1500 K). Our four targets display a small or negligible NIR excess above the photospheric value (note the λturn - off values in Table 1), suggesting that they contain cavities that are largely evacuated of dust, therefore we treated log (δcav) as a variable to be established by the data.
We adopted the opacity spectrum given by Andrews et al. (2009), who considered the silicate and graphite abundances determined for the ISM, and updated optical properties. The grain size distribution, n(a) ∝ a-3.5, extends in diameters from amin = 0.005 μm up to amax = 1 mm, and the opacities were calculated with a simple code for Mie scattering.
The stellar properties given in Table 1 were in each case fixed inputs for the models, and Kurucz spectra were used as models of the central stars. As the disk SED is not influenced by the λ ≲ 3 μm fluxes, they were not included in the final fit, avoiding a systematic error term (shift in the χ2). For each disk, we explored the parameter space, { Mdisk, H100, Rcav, log δcav } , by generating Monte Carlo Markov chains, which is a parameter space exploration technique designed to provide the best-fitting values and their uncertainties. This technique is more effective than classical data fitting methods (e.g., Press et al. 1992; Gregory 2005) for problems with large numbers of parameters, as in our case. In the fitting procedure, we followed Ford (2005) and Gregory (2005). The marginal probability distribution for each parameter was derived from the MCMC chains. The 90% percentile of these distributions2 which wassimmetrically centered on the mode when possible (or using the larger side if not) was used to define the error estimates within a conservative approach.
4. Results
The estimated parameters that most clearly reproduce the data for our planet-forming disk candidates are listed in Table 2, while the corresponding SEDs are shown in Fig. 1. These fits have reduced  , i.e. the χ2 considering only the observational data point errors, and divided by the number of degrees of freedom. The disk masses obtained are within a factor ~2 than the rough estimates in paper I, which were based on a single (sub)millimeter flux. We found that H100 ≲ 2−6 AU in all four cases, with estimated uncertainties i.e. ≲1.5 AU. The so-called settling ratio of the dust scale heights to the scale heights of the gas, which is in hydrostatic equilibrium, was found to be 0.13–0.25. In particular for Tran 32 we fitted a rather flat geometry, with the smallest H100 in our sample. This disk also has the largest cavity and is bright enough to be detected by the SMA extended configuration. A simultaneous SED + image fit will be presented in a future paper.
To compare our results with an alternative model, we used the precomputed grid of SEDs by Robitaille et al. (2007). A cavity was also inferred in all four cases, with Rcav ~ 4−38 AU, as well as some dust settling leading to flat geometries (H100 ≲ 4 AU). However, the on-line fitting tool fails to accurately reproduce the SED for two of our targets, Tran 11 and 32. A discussion on the preferential use of RADMC to model transitional disks and comments on the alternative observational characterization of them can be found in Merín et al. (2010).
Model parameters.
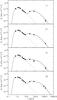 |
Fig. 1 Best-fit SEDs (solid lines) obtained using RADMC, in the context of a flared disk model with an inner cavity. The dashed line shows the input stellar-model atmosphere. The filled circles are extinction-corrected values, while the arrows are upper limits. |
5. Discussion
Non-linear model fitting has been applied to many areas of astrophysics including disk modeling by Isella et al. (2009). They have used the two layer approximation of Chiang & Goldreich (1997), while we have computed the thermal structures with significant detail using the RADMC code. In this study, we have followed the literature by Andrews et al. (same parametric model and opacities), who performed refined grid searches over eight parameters. Their pertinent comments on the technical obstacles (Andrews et al. 2011) and non-uniqueness of the fit, also apply to our approach.
We have estimated some of the physical parameters describing the dust structures of four transition disk systems that are excellent candidates for ongoing giant planet formation. The cavities sizes inferred for our targets, Rcav = 2−8 AU, agree with the distribution of semi-major axis of exoplanets, which has a bi-modal behavior, peaking at ~0.05 and 2 AU and extending up to ~10 AU3. The mass of the disks and the actual size of their inner holes depend on the assumed opacities. The small scale-height of the dust in all our targets suggest this could be a characteristic property of planet-forming disks. These are interesting results that should be investigated with further modeling and follow-up observations.
We have attempted (~104 model runs for disk) to provide a set of best-fitting parameters and their confidence regions through the application of Bayesian methods, but the real strength of the results might yet be unclear given the degeneracy of the model for some of the parameters we have fixed. An illustration is the case of Tran 11, for which a cavity radius Rcav = 3 ± 2 AU, and a settling parameter that translates into ψ = 0.07 were found by Merín et al. (2010) when setting Rc = 200 AU. We used Rc = 100 AU, ψ = 0.2 and obtained Rcav = 4.8 ± 2.5 AU.
The disk masses obtained here cover a rather wide range of masses, from ~0.6 MJUP to ~17 MJUP that extends the mass range to lower values than studied by Andrews et al., i.e. 5−42 MJUP for systems that have been modeled in the same way, i.e. with same parameterizations and opacity tables. However, Andrews et al. (2009, 2010a) fitted their systems with larger values of the depletion factor, δcav ~ 10-4−10-2, and obtained larger cavities, Rcav = 20−40 AU. We note that in Andrews et al. (2011), where the model included a more complex surface-density profile (i.e. with an inner disk inside the cavity) the range of masses estimated for 12 disks with resolved images was ~8−128 MJUP but comparisons could be misleading in this case. Some differences are probably the result of a selection effect. While Andrews et al. selected their targets based on large (sub)millimeter fluxes, our selection criterion is based on the slope of IR SEDs, and the presence of accretion.
At a southern declination of ~25 deg and a distance of ~125 pc, our targets are excellent targets for follow-up studies with Herschel and the Atacama Large Millimeter Array (ALMA) to investigate their properties in more detail. In particular, the study of the small holed transition disks will benefit greatly from their higher spatial resolution. Herschel far-IR photometry would bridge the gap between the mid-IR and the (sub)mm wavelengths accessible from the ground and help to more tightly constrain the scale-heights and the flaring angles of the disks. Herschel spectroscopy of fine structure lines, such as the 63.2 μm [O I] line, could help us to probe their gas content, hence their gas-to-dust mass ratio. Similarly, resolved images with ALMA will break some of the degeneracies of the models and allow us to mopre clearly understand the physical properties
of these fascinating disks, thereby helping us to elucidate the conditions in which planets are formed.
Two of the 70 μm measurements given in Paper I are upper limits.
Note that there is no guarantee that the marginal distribution is Gaussian so the dispersion of the sample can only be a rough indicator of the probable error as in Isella et al. (2009).
Exoplanets database, http://exoplanets.org
Acknowledgments
We acknowledge useful discussions with C. Dullemond and S. Andrews. We thank H. Bouy for explanations. M.O. was supported by ALMA-CONICYT (31070021) and ANPCyT PICT 2007 00848/Prestamo BID. M.R.S. acknowledges support from Millennium Science Initiative, Chilean ministry of Economy: Nucleus P10-022-F.
References
- Andrews, S. M., & Williams, J. P. 2005, ApJ, 631, 1134 [NASA ADS] [CrossRef] [Google Scholar]
- Andrews, S. M., & Williams, J. P. 2007, ApJ, 671, 1800 [CrossRef] [Google Scholar]
- Andrews, S. M., Wilner, D. J., Hughes, A. M., et al. 2009, ApJ, 700, 1502 [NASA ADS] [CrossRef] [Google Scholar]
- Andrews, S. M., Wilner, D. J., Hughes, A. M., et al. 2010a, ApJ, 723, 1241 [NASA ADS] [CrossRef] [Google Scholar]
- Andrews, S. M., Czekala, I., Wilner, D. J., et al. 2010b, ApJ, 710, 462 [NASA ADS] [CrossRef] [Google Scholar]
- Andrews, S. M., Wilner, D. J., Espaillat, C., et al. 2011, ApJ, 732, 42 [NASA ADS] [CrossRef] [Google Scholar]
- Brown, J. M., Blake, G. A., Qi, C., et al. 2008, ApJ, 675, L109 [NASA ADS] [CrossRef] [Google Scholar]
- Brown, J. M., Blake, G. A., Qi, C., et al. 2009, ApJ, 704, 496 [NASA ADS] [CrossRef] [Google Scholar]
- Chiang, E. I. & Goldreich, P. 1997, ApJ, 490, 368 [NASA ADS] [CrossRef] [Google Scholar]
- Cieza, L. A. 2008, ASPC, New Horizons Astron., 393, 35 [NASA ADS] [Google Scholar]
- Cieza, L., Padgett, D. L., Stapelfeldt, K. R., et al. 2007, ApJ, 667, 308 [NASA ADS] [CrossRef] [Google Scholar]
- Cieza, L. A., Schreiber, M. R., Romero, G. A., et al. 2010, ApJ, 712, 925 (Paper I) [NASA ADS] [CrossRef] [Google Scholar]
- Dominik, C., Blum, J., Cuzzi, J. N., Wurm, G. 2007, Protostars and Planets V (University of Arizona Press), 783 [Google Scholar]
- Dullemond, C. P. & Dominik, C. 2004, A&A, 417, 159 [NASA ADS] [CrossRef] [EDP Sciences] [Google Scholar]
- Ford, E. B. 2005, ApJ, 129, 1706 [NASA ADS] [CrossRef] [Google Scholar]
- Furlan, E., Hartmann, L., Calvet, N., et al. 2006, ApJS, 165, 568 [NASA ADS] [CrossRef] [MathSciNet] [Google Scholar]
- Gregory, P., 2005, Bayesian Logical Data Analysis for the Physical Sciences (Cambridge University Press) [Google Scholar]
- Huélamo, N., Lacour, S., Tuthill, P., et al. 2011, A&A, 528, L7 [NASA ADS] [CrossRef] [EDP Sciences] [Google Scholar]
- Hughes, A. M., Wilner, D. J., Calvet, N., et al. 2007, ApJ, 664, 536 [NASA ADS] [CrossRef] [Google Scholar]
- Hughes, A. M., Andrews, S. M., et al. 2009, ApJ, 698, 131 [NASA ADS] [CrossRef] [Google Scholar]
- Isella, A., Carpenter, J. M., & Sargent, A. I. 2009, ApJ, 701, 260 [NASA ADS] [CrossRef] [Google Scholar]
- Loinard, L., Torres, R. M., Mioduszewski, A. J., Rodríguez, L. F. 2008, ApJ, 675, L29 [NASA ADS] [CrossRef] [Google Scholar]
- McClure, M. K., Furlan, E., Manoj, P., et al. 2010, ApJS, 188, 75 [NASA ADS] [CrossRef] [Google Scholar]
- Merín, B., Brown, J. M., Oliveira, I., et al. 2010, ApJ, 718, 1200 [NASA ADS] [CrossRef] [Google Scholar]
- Najita, J. R., Strom, S. E., & Muzerolle, J. 2007, MNRAS, 378, 369 [NASA ADS] [CrossRef] [Google Scholar]
- Natta, A., Testi, L., Muzerolle, J., et al. 2004, A&A, 424, 603 [NASA ADS] [CrossRef] [EDP Sciences] [Google Scholar]
- Nutter, D., Ward-Thompson, D., & André, P. 2006, MNRAS, 368, 1833 [NASA ADS] [CrossRef] [Google Scholar]
- Piétu, V., Dutrey, A., Guilloteau, S., et al. 2006, A&A, 460, L43 [NASA ADS] [CrossRef] [EDP Sciences] [Google Scholar]
- Pinte, C., Ménard, F., Berger, J. P., et al. 2007, ApJ, 673, L63 [Google Scholar]
- Press, W. H., Flannery, B. P., Teukols, S. A., et al. 1992, C Numerical recipes (Cambridge University Press) [Google Scholar]
- Siess, L., Dufour, E., & Forestini, M. 2000, A&A, 358, 593 [NASA ADS] [Google Scholar]
- Robitaille, T. P., Whitney, B. A., Indebetouw, R., & Wood, K. 2007, ApJS, 169, 328 [NASA ADS] [CrossRef] [Google Scholar]
- Varniére, P. Blackman, E. G. Frank, A. & Quillen, A. C. 2006, ApJ, 640, 1110 [NASA ADS] [CrossRef] [Google Scholar]
- Williams, J. P & Cieza, L. A. 2011, A&ARA, 2011, 49, 67 [Google Scholar]
All Tables
All Figures
|
Fig. 1 Best-fit SEDs (solid lines) obtained using RADMC, in the context of a flared disk model with an inner cavity. The dashed line shows the input stellar-model atmosphere. The filled circles are extinction-corrected values, while the arrows are upper limits. |
| In the text | |
Current usage metrics show cumulative count of Article Views (full-text article views including HTML views, PDF and ePub downloads, according to the available data) and Abstracts Views on Vision4Press platform.
Data correspond to usage on the plateform after 2015. The current usage metrics is available 48-96 hours after online publication and is updated daily on week days.
Initial download of the metrics may take a while.