| Issue |
A&A
Volume 537, January 2012
|
|
|---|---|---|
| Article Number | A113 | |
| Number of page(s) | 12 | |
| Section | Interstellar and circumstellar matter | |
| DOI | https://doi.org/10.1051/0004-6361/201117956 | |
| Published online | 17 January 2012 | |
Detection and characterization of a 500 μm dust emissivity excess in the Galactic plane using Herschel/Hi-GAL observations⋆
1 Université de Toulouse, UPS-OMP, IRAP, Toulouse, France
e-mail: paradis@cesr.fr
2 CNRS, IRAP, 9 Av. du Colonel Roche, BP 44346, 31028 Toulouse Cedex 4, France
3 Spitzer Science Center, California Institute of Technology, 1200 E. California Blvd, Pasadena, CA 91125, USA
4 Dipartimento de Fisica, Universita di Roma 1 La Sapienza, Roma, Italy
5 Centre for Astrophysics Research, Science and Technology Research Institute, University of Hertfordshire, Hatfield, UK
6 INAF – Instituto Fisica Spazio Interplanetario, via Fosso del Cavaliere 100, 00133 Roma, Italy
Received: 26 August 2011
Accepted: 7 November 2011
Context. Past and recent observations have revealed unexpected variations in the far-infrared – millimeter (FIR-mm) dust emissivity in the interstellar medium. In the Herschel spectral range, those are often referred to as a 500 μm emission excess. Several dust emission models have been developed to interpret astrophysical data in the FIR-mm domain. However, these are commonly unable to fully reconcile theoretical predictions with observations. In contrast, the recently revised two level system (TLS) model, based on the disordered internal structure of amorphous dust grains, seems to provide a promising way of interpreting existing data.
Aims. The newly available Herschel infrared GALactic (Hi-GAL) data, which covers most of the inner Milky Way, offers a unique opportunity to investigate possible variations in the dust emission properties both with wavelength and environment. The goal of our analysis is to constrain the internal structure of the largest dust grains on Galactic scales, in the framework of the TLS model.
Methods. By combining the IRIS (Improved Reprocessing of the IRAS Survey) 100 μm with the Hi-GAL 160, 250, 350, and 500 μm data, we model the dust emission spectra in each pixel of the Hi-GAL maps, using both the TLS model and, for comparison, a single modified black-body fit. The effect of temperature mixing along the line of sight is investigated to test the robustness of our results.
Results. We find a slight decrease in the dust temperature with distance from the Galactic center, confirming previous results. We also report the detection of a significant 500 μm emissivity excess in the peripheral regions of the plane (35° < |l| < 70°) of about 13–15% of the emissivity, which can reach up to 20% in some HII regions. We present the spatial distributions of the best-fit values for the two main parameters of the TLS model, i.e. the charge correlation length, lc, used to characterize the disordered charge distribution (DCD) part of the model, and the amplitude A of the TLS processes with respect to the DCD effect. These distributions illustrate the variations in the dust properties with environment, in particular the plausible existence of an overall gradient with distance to the Galactic center. A comparison with previous findings in the solar neighborhood shows that the local value of the excess is less than expected from the Galactic gradient observed here.
Key words: infrared: ISM / dust, extinction / submillimeter: ISM
© ESO, 2012
1. Introduction
The interstellar medium (ISM) is where matter from diffuse clouds is brought into stars. In this context, studying dust evolution is important as variations in the properties of the ISM constituents likely affect the star formation process. In addition, understanding the emission from big grains (BGs) is important in interpreting experiments devoted to the observation of the cosmic microwave background (CMB) and its fluctuations. These experiments typically operate in the millimeter domain, where the cosmological signal is dominated by the Galactic foreground emission, of which dust is one of the components.
The spectral energy distributions (SEDs) of BGs can be approximated by modified black-body emission  (1)where Iν(λ) is the brightness, ϵν is the dust emissivity per hydrogen column, Bν is the Planck function, Td is the dust temperature, and NH is the hydrogen column density. When Eq. (1) is used to interpret the observed emission, ϵν is the mean dust emissivity along the line of sight (LOS). This approximation is justified because the medium is optically thin in the far-infrared (FIR) and submillimeter (submm). The dust temperature is however expected to vary along the LOS (see Sect. 4.2.2). The dust emissivity is usually defined as
  (2)where ϵν(λ0) is the emissivity at wavelength λ0, and β is the emissivity spectral index, usually taken to be equal to 2. In recent years, however, an increasing number of studies have found that the emissivity might actually depart from a simple λ-2 power-law. Indeed, the emissivity spectral index seems to be temperature-dependent: its value has been shown to decrease with increasing temperature (Dupac et al. 2003; Désert et al. 2008; Veneziani et al. 2010; Paradis et al. 2010). This Td-β anti-correlation has been extensively debated. Some authors claim that this behavior is only the consequence of mis-handling noisy data and/or temperature mixing along the LOS (Shetty et al. 2009). However, all the aforementioned studies have concluded that the effect was not due to noise, and some analyses have included tests that rejected temperature mixing as the cause of the observed trend (Paradis et al. 2009; Malinen et al. 2011). We note that in some extreme cases, the inferred β values can reach up to 3.5–4 at low apparent temperatures ( ≤ 10 K), which appears very difficult to reconcile with a single value of β and temperature mixing effects. It appears more likely that actual variations in the dust emissivity are at play.
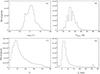 |
Fig. 1 Histograms of the 500 μm emissivity excess (panel A), results of the TLS modeling: the dust temperature (panel B), the A parameter (panel C) as defined in Eq. (5), and the lc parameter (panel D), as defined in Eq. (4). |
Emissivity variations also appear to be wavelength-dependent with the emission spectrum flattening in the submillimeter (λ > 500−600 μm) relative to a single modified black-body emission (Wright et al. 1991; Reach et al. 1995; Finkbeiner et al. 1999; Galliano et al. 2005; Paladini et al. 2007; Paradis et al. 2009, 2011a). They also appear to be environment-dependent (see, for instance, Li 2005, for a review), with an absolute emissivity value in the FIR (λ < 500−600 μm) that is higher in colder and denser environments (Stepnik et al. 2003; Paradis et al. 2009; Planck collaboration 2011e). Moreover, the analysis of the Planck data in the solar neighborhood and both the Large and Small Magellanic Clouds (Planck collaboration 2011c,b) indicates that the flattening of the emissivity spectrum could be related to the metallicity, because it is more significant in low metallicity environments. From the astrophysical point of view, grain aggregation in the core of dense clouds could, in principle, explain the observed absolute FIR emissivity excess, if one assumes that aggregates emit more FIR radiation than individual grains. Nevertheless, this interpretation is only partially satisfactory, since grain aggregation may affect only the absolute values and not necessarily the shape of the emissivity, and the aforementioned excess has only been reported for some Galactic molecular clouds, while in the extragalactic context, such as in the Large Magellanic Cloud (Paradis et al. 2011b), it has not been found at all.
In this work, we study the FIR/submm data obtained for the first and fourth Galactic quadrants through the Herschel infrared GALactic (Hi-GAL) survey (Molinari et al. 2010a,b), and demonstrate the existence of a submm emissivity excess. Thanks to the sub-arcmin resolution, comprehensive sky coverage, and broad wavelength range spanned by the Hi-GAL data, we can for the first time perform a systematic investigation of such an excess in our Galaxy. In addition, the Galactic plane is ideal for conducting such an analysis because it contains a variety of different environments, from diffuse clouds to compact sources, and from cold to warm structures, which can potentially harbor different dust properties. We also show that we are able to reconcile the observed excess with theory predictions using the two level system (TLS) model, which provides a sophisticated analytical description of the disordered internal structure of amorphous dust grains.
The paper is organized as follows. In Sect. 2, we introduce the observational data that we use in this work. Sections 3 and 4 focus on the variations in the emissivity spectral shape and the origin of these variations. Section 5 provides our conclusions.
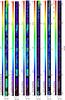 |
Fig. 2 From left to right: 500 μm emissivity excess (in percent) and dust temperature derived from a modified black-body emission, and the results of the TLS modeling for dust temperature (TTLS) in K, intensity of the TLS processes (A), correlation length (lc) in nm, and reduced χ2. |
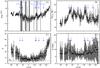 |
Fig. 3 500 μm emissivity excess (panel A), dust temperature (panel B), A parameter (panel C), and lc parameter (panel D), as a function of Galactic longitudes. The dashed line shows the solar neighborhood value when normalized to cΔ,s = 475. The vertical error bars correspond to the 1-σ standard deviation. The blue arrows show the tangent directions of the spiral arms at l = −50°, –33°, –21°, and 31° (Vallée 2008) and of the 3 kpc ring at |l| = 23° (Dame & Thaddeus 2008). |
2. Data
The reference database for our investigation consists of the Hi-GAL dataset, a collection of 56 tiles of 2° × 2°, with the longitude range –70° < l < 70°, and an extension of 2° in latitude, following the Galactic warp. The Hi-GAL PACS (70 and 160 μm) and SPIRE (250, 350, and 500 μm) data (Pilbratt et al. 2010; Poglitsch et al. 2010; Griffin et al. 2010) were processed using the ROMAGAL software, described in Traficante et al. (2011). We also used ancillary IRIS (Improved Reprocessing of the IRAS Survey, see Miville-Deschênes & Lagache 2005) data to constrain the peak of the BG emission. We corrected the gains and zero-level in the SPIRE and PACS images by applying gains and offsets derived from the comparison to a combination of the Planck-HFI (High Frequency Instrument) and the IRIS observations, using the same procedure as in Bernard et al. (2010). A forthcoming paper will be dedicated to the intercalibration of the Hi-GAL data with existing photometric data (Bernard et al. in prep.). A full description of the Planck mission is provided in Tauber et al. (2010) and the Planck collaboration (2011a). The Hi-GAL data (θ = 6′′ to 37′′ from 160 to 500 μm) were convolved to a 4′ angular resolution to match the resolution of the IRIS data. In addition, each tile was re-projected using the HEALPIx pixelization scheme (Hierarchical Equal Area isoLatitude Pixelization)1 with nside=2048, which corresponds to a pixel size of 1.7′, i.e. adequate for Shannon sampling of the adopted resolution. We used the surface area of the intersection between the HEALPix and the native pixel as a weight to reproject the data. After reprojecting, all the fields were combined into a single HEALPix file covering the entire inner Galactic plane. We adopted the same absolute calibration accuracy as for the SDP fields in the PACS data, i.e. 20%, and 13.5% for IRIS 100 μm. The calibration of the SPIRE data was recently revised leading to an accuracy of 7%. As a conservative approach, we did not include the PACS 70 μm data in the analysis because at this wavelength we are probably most sensitive to emission from very small grains (VSGs), which are stochastically heated by photon absorption (Compiègne et al. 2010). This contribution can only be roughly evaluated and can severely bias the derivation of the BG temperature (especially for Td < 25 K).
3. Emissivity excess at 500 μm
A break in the observed emissivity law around 500 μm has been identified in the outer Galaxy (Paradis et al. 2009) from the analysis of DIRBE (Hauser 1993), Archeops (Benoît et al. 2002), and WMAP (Bennett et al. 2003) data, as well as in the Large Magellanic Cloud based on Herschel data (Gordon et al. 2010; Galliano et al. 2011). However, in the two Hi-GAL science demonstration phase (SDP) fields (centered at l = 30° and l = 59°), Paradis et al. (2010) did not find any significant emissivity excess at 500 μm, even when taking calibration uncertainties into account. The goal of the present work is to investigate the existence of this break. For this purpose, we fit the Hi-GAL/IRIS emission in the range 100 μm < λ < 350 μm in each pixel with a single modified black body, adopting a least squares fit method. We assume that calibration uncertainties are distributed following a Gaussian function. The dust temperature is set as a free parameter. We then compare the observed emissivity at 500 μm ( ) with the value predicted by extrapolating the best-fit emissivity power-law to 500 μm (
 ). We define the 500 μm excess as the quantity
  (3)To perform the fit described above, we need to adopt a value for the emissivity spectral index β. A recent analysis of the Planck data (Planck collaboration 2011c) has found, for 100 μm < λ < 850 μm, a median β value of 1.8 over the entire sky. In contrast, Paradis et al. (2010) obtained, for 100 μm < λ < 500 μm, a median β value of 2.3 in both of the Hi-GAL SDP fields. In the light of these results, we decide to keep β fixed and equal to 2. We note that this assumption is a matter of how the excess is defined and only affects the amplitude of the excess and not its spatial distribution.
In Fig. 1 (panel A), we show the pixel distribution of the emissivity excess at 500 μm (e500) derived from the fitting procedure. The distribution is clearly not centered at zero (as would be the case for pure noise), but instead visibly skewed towards positive values. The median of the distribution is 0.8%, with a σ of 4.2%. Excess values larger than 13.4% exceed the 3-σ standard deviation of the distribution and are significantly larger than the calibration uncertainty of the SPIRE data (cf. Sect. 2).
We emphasize that this result, i.e. the existence of a significant excess of emission at 500 μm, does not depend on the particular value adopted for β in the modified black-body fit. If we repeated the analysis with a different spectral emissivity value, for example β equal to 1.8 instead of 2, the shape of the excess distribution would remain unchanged, although it would shift towards more negative values, suggesting that, for the majority of the pixels, the model overestimates the data. Incidentally, we note that this also corroborates the hypothesis that, at least along the inner Galactic plane, β is indeed larger than 1.8.
Figure 2 illustrates the spatial distribution of the 500 μm excess across the Galactic plane. Inspection of the map reveals a more pronounced excess in the peripheral regions (35° < |l| < 70°) than in the central ones (|l| < 35°). This effect also appears in Fig. 3, panel A, where we have plotted the median value of the excess at each Galactic longitude, and its associated 1-σ standard deviation. In particular, for −70° < l < −60° the excess becomes significant, contributing to as much as 16–20% of the total emissivity, and even reaching values larger than 23% toward some HII regions. Regions in the proximity of the Galactic center, where a ring of dense and cold clouds has been identified at the Herschel resolution (Molinari et al. 2011), however, do not exhibit any excess. The spatial distribution of the excess does not display any particular symmetry either: for instance, the significant increase in the fourth Galactic quadrant around l < −50° is not mirrored by a corresponding increase within the same longitude range in the first quadrant. Remarkably, the morphological behavior that characterizes the 500 μm excess is – per se – an indication that this effect is not related to calibration uncertanties, as these would have an equal impact on different regions of the plane. In the specific fields of l = 30° and l = 59°, the median value of the excess is 1% and 3%, which does not correspond to any significant detection, in agreement with the findings in Paradis et al. (2010).
The submm excess could, in principle, be induced by the fitting procedure. To test this hypothesis, we carried out two tests: first, we included in the fit all data points for 100 μm ≤ λ ≤ 500 μm; second, we performed the fit by replacing the 350 μm data point with the 500 μm data. Both tests provided larger reduced χ2 than the original fit (on average, by a factor of 2.3 and 2.6), thus supporting the idea that this excess has an astrophysical origin.
In the following, we investigate in detail the 500 μm excess in the framework of the TLS model, by analyzing variations in the model parameters.
4. Towards an understanding of the nature of the excess
4.1. The TLS model
We now provide a brief description of the TLS model. We refer the reader to Mény et al. (2007) for a fuller description.
Parameters of the TLS model and their 1-σ standard deviation.
Our revised TLS model is based on both solid state physics and laboratory measurements, and provides an accurate description of the physical properties of amorphous grains. It consists of two parts: (1) the disordered charge distribution (DCD) one, which describes the interaction between the electromagnetic wave and acoustic oscillations in the disordered charge of the amorphous material (Vinogradov 1960; Schlömann 1964); and (2) the actual TLS part, which takes the interaction of the electromagnetic wave with the simple distribution of an asymmetric double-well potential into account. This second part corresponds to a theory originally developped by Phillips (1972, 1987) and Anderson et al. (1972). The first effect (DCD) is temperature-independent, occurs on the grain scale and is the most dominant effect in the FIR. Moreover, it has two types of asymptotic behaviors at both lower and higher frequencies than ω0: ϵν ∝ λ-2 in the short wavelength range, i.e. ω > ω0, and ϵν ∝ λ-4 in the long wavelength range, i.e. ω < ω0. This DCD effect is characterized by the so-called correlation length lc, which determines the wavelength at which the inflection point between the two asymptotic behaviors occurs. This parameter is defined in the ω0 term by  (4)where vt is the transverse sound velocity in the material. The TLS effects, which consist of three mechanisms (a resonant absorption and two relaxation processes, thermally activated), are instead temperature-dependent, take place on the atomic scale, and start to be important in the submm domain, becoming the predominant effects in the mm wavelength range. The amplitude of the TLS effects with respect to the DCD part is determined by the intensity parameter denoted with A. This means that all TLS processes are multiplied by the same intensity A. The total emission deduced from the TLS model (Itot) is then the sum of the emissions coming from the DCD (IDCD) and TLS processes (ITLS), such as
  (5)Paradis et al. (2011a) performed a comparison between the model predictions and astrophysical data to determine the model parameters. They analyzed both the FIR/mm SED of the solar neighborhood using FIRAS and WMAP data, and of Galactic compact sources observed with the Archeops experiment. The purpose of their analysis was to constrain the four key parameters of the TLS model, namely: (1) the charge correlation length lc for the DCD absorption; (2) the amplitude A of the TLS effects, with respect to the DCD process; (3) a parameter cΔ describing the double-well potential for one of the TLS processes; and (4) the dust temperature TTLS. The combined fit of the SEDs for the solar neighborhood and the compact sources provided a general description of Galactic dust in terms of these parameters, whose best-fit values are lc,s = 13.4 nm, As = 5.8, and cΔ,s = 475 (see also Table 1), which were referred to as the standard values.
In the following, we repeat the fitting procedure described in Sect. 3, using this time the TLS model rather than a modified black body. The best-fit values for the TLS parameters derived from the fit are then compared to the standard ones, and those obtained for the solar neighborhood and compact sources. Before describing the results we obtained, a few considerations need to be made. First, we note that the cΔ parameter is, to first order, degenerate with the A parameter. In addition, cΔ cannot be tightly constrained in our study because we are limited to wavelengths shorter than 500 μm. For this reason, following Paradis et al. (2011a), we set cΔ to be equal to the standard value, (cΔ,s = 475).
As for lc, we adopt 36 nm as an upper limit. For lc ≥ 36 nm, the DCD process indeed reaches an asymptotic behavior in λ-2 from FIR to mm wavelengths. Values of lc of the order of a few nanometers, combined with either small or null values of A, allow β to be instead close to 4. The slope of the spectra increases with decreasing lc, in the absence of significant TLS processes. As analyzed in Paradis et al. (2011a), for the range 100–550 μm, A = 0.1 and lc = 1 nm (30 nm), the parameter β is expected to be constant with a value of 3.4 (2.0), regardless of the dust temperature (see their Fig. 7, middle panel). However, for A = 10 and lc = 1 nm (30 nm), β varies from 2.45 ( ≃ 1.85) to 1.4 (1.35) for temperatures between 10 K and 55 K.
4.2. Dust properties along the Galactic plane
4.2.1. Method
To minimize the computing time, we pre-calculated the brightness in the IRIS 100 μm and Herschel bands using the TLS model, taking into account the color-correction to be applied to each instrument. In this way, we generated a multi-dimensional grid, for different TTLS between 10 K and 40 K (with a 0.5 K step), lc in the range 1–36 nm (with a 1 nm step), and 50 values of A between 0 and 50. We then compared the brightness expected from the TLS model with the observed brightness in each pixel of the map. The χ2 value was computed for each value of the grid, and we chose the value of the parameters (p) that minimizes the χ2. Calibration uncertainties were included in the fit as described in Sect. 3. To allow interpolation between individual entries of the table, the best-fit parameter values (p ⋆ ) are computed for the ten smallest values of χ2 using  (6)Since Planck data are not yet available, we are unable to place tight constraints on the A parameter using only Herschel data.
A normalization of the dust emission predicted by the TLS model is required. We adopt the normalization 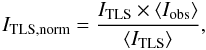 (7)where ITLS and ITLS,norm are the emission spectrum from the TLS model before and after the normalization, while ⟨ Iobs ⟩ and ⟨ ITLS ⟩ are the emission averaged in wavelength between 100 μm and 500 μm, corresponding, respectively, to the observations and the TLS model.
4.2.2. Dust temperature and emissivity
The spatial distribution of the dust temperature, as well as the reduced χ2 obtained through the TLS modeling are presented in Fig. 2. The temperature histogram is shown in Fig. 1 (panel B). We note that the reduced χ2 values are systematically smaller than 1, suggesting that the uncertainties in the observational data are probably overestimated, particularly for the PACS data. The median temperature along the Galactic plane is 18.6 K, while the Galactic center exhibits temperatures in the range 18–25 K. As reported in Molinari et al. (2011), some cold clumps can be found in this region, with temperatures of about 16–18 K. However, with respect to Molinari et al. (2011), we do not find any evidence of temperatures above 25 K. This may be for several reasons. First, our temperature map was generated at 4′ angular resolution, instead of 25′′ as in Molinari et al. (2011). Secondly, the 70 μm was not included in our analysis, which might have caused the underestimation of the warmest dust temperatures.
In general, temperatures appear to be higher in the central regions of the Galaxy (TTLS = 19.4 K for |l| < 35°), and to decrease with increasing longitude (TTLS = 18.0 K for 35° < |l| < 70°), as one can clearly see in Fig. 3 (panel B). This general behavior has been seen before using DIRBE (Sodroski et al. 1994), FIRAS (Reach et al. 1995), and Planck data (Planck collaboration 2011c). Temperatures span the range 16 K–26 K (Fig. 1, panel B). A the IRIS resolution, the Galactic plane remarkably does not show dust temperatures below 15 K. Some warm spots with TTLS ≥ 30 K are, however, visible in the peripheral regions, probably owing to HII regions. These warm spots also show the largest 500 μm emissivity excess. The comparison between temperatures estimated with the TLS model and those derived from the modified black-body fit in the range 100–350 μm with β = 2 (Tfit) is provided in Fig. 4. As described in Paradis et al. (2011a), there is good agreement between the two methods up to ≃25 K, where a departure from a one-to-one correlation becomes noticeable. The dust temperature is only taken into account in the Planck function in the case of a modified black-body fit, whereas the TLS processes are temperature-dependent and increase with temperature. As a consequence, the difference in the temperature contribution in the two methods could explain the departure in the TTLS–Tfit correlation at high temperatures, and especially the faster increase in TTLS compared to Tfit for temperatures higher than 25 K. The outlier points (Tfit > 20 K) correspond either to pixels with a low quality χ2 for the modified black-body fit, or to edges of the map.
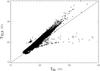 |
Fig. 4 Temperature derived using the TLS model (TTLS), as a function of temperature derived from a modified black-body fit with β = 2 (Tfit). |
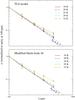 |
Fig. 5 Average emissivity spectra in five bins of temperature and their 1-σ uncertainty: 16 K in red (solid), 20 K in dark blue (dash), 24 K in light blue (dot), 28 K in green (dash-dot), and 32 K in orange (dash-dot-dot). The emissivities have been computed using the best-fit with the TLS model (top panel) and with a modified black body with β = 2 (bottom panel). An emissivity power-law in λ-2 is overplotted as a continuous gray line, for comparison. |
In Fig. 5, we have plotted the average dust emissivities, for 100 μm < λ < 500 μm, in five dust temperature bins centered at 16, 20, 24, 28, and 32 K. The plots have been created for both the TLS model and a modified black-body fit with β = 2. In the first case (TLS model), we computed the dust emissivity spectra using the best-fit model parameters (TTLS, A, and lc) for each pixel, that we averaged per temperature bin. We derived the averaged emissivity in the photometric bands by applying the adequate color-correction for each instrument. In the second case (modified black-body fit), we divided the brightness coming from the data by the Planck function at the temperature Tfit. The emissivity spectra were normalized to unity at 100 μm. The uncertainties in the emissivity were computed using 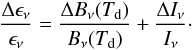 (8)The relative error ΔBν(Td)/Bν(Td) is related to the error on Td (ΔTd) as
  (9)The figure highlights the existence, for both models, of a clear trend in the emissivity spectra with the dust temperature, with the spectra being flatter with increasing dust temperature. This observed flattening behavior with Td cannot be accounted for by the calibration error at 500 μm. If the brightness at 500 μm were systematically off by 7% owing to calibration uncertainties, all emissivity spectra would be affected but this should not induce a change in the dust temperature. Another effect has to be considered. Given that we conducted our analysis along the Galactic plane, where temperature mixing is expected along the LOS, one may argue that we can introduce an artificial bias by fitting the data points with a single dust temperature. To address this question, following Dale et al. (2001), we computed the predicted brightness in each IRIS and Herschel band for different values of the interstellar radiation field intensity, XISRF, relative to the intensity of the ultraviolet field in the solar neighborhood (Mathis et al. 1983).
The Dale et al. (2001) model describes a temperature distribution using the concept of local SED combination, and assumes a power-law distribution of dust mass subjected to a given heating intensity dMd(XISRF)  (10)where α and XISRF are in the range 1 < α < 2.5 and 0.3 < XISRF < 105. With this representation, the diffuse medium has α close to 2.5, whereas active star-forming regions have α of 1. We estimated the emission spectra (
 ), for different values of α, using the DustEM package (Compiègne et al. 2008, 2011) and assuming β = 2. We then summed these contributions over the same XISRF range proposed by Dale et al. (2001)
 (11)We then compared the observational data with the predicted SEDs, and searched for the optimal α value that minimizes the difference between the two. As a result of this process, each pixel of the map has an emission that incorporates temperature mixing along the LOS. Figure 6 is an illustration of the pixel-to-pixel map of the recovered α values. The central regions of the Galactic plane are characterized by values of α in the range [1.9, 2.5], while for |l| > 30°, α appears to be systematically equal to the asymptotic value of 2.5. At the same type, inspection of the reduced χ2 spatial distribution (also shown in Fig. 6) reveals that the SEDs for most of the peripheral regions are not well reproduced by the Dale et al. (2001) model. In these regions, temperature mixing is probably less important than in the central regions of the Galaxy.
 |
Fig. 6 Left panel: α parameter from the Dale et al. (2001) model. Right panel: reduced χ2 deduced from the comparison between data and the Dale et al. (2001) model. |
We considered only pixels with reduced χ2 < 1.5. Modeling with a reduced χ2 ≥ 1.5 does not give a satisfactory fit. The spatial distribution of the reduced χ2 is provided in Fig. 6. This selection removes 39% of the pixels, and in particular the peripheral parts or the map, corresponding essentially to the coldest parts of our map. We then proceeded as before, with the difference that we treated the brightness derived from the best-fit Dale et al. (2001) model for the selected pixel (61% of the Galactic plane) as “real” data: we performed a χ2 minimization, using the TLS model and a modified black-body emission model with β = 2, to derive the best-fit parameters and the emissivity spectra for different temperature bins. Since the coldest regions had been rejected from the analysis, the temperature bins ranged from 19.1 K to 31.9 K.
If temperature mixing did indeed account for the flattening of the spectra with increasing dust temperature, we would expect to observe the same type of behavior with this test. However, as shown in Fig. 7, the spectra do not show any sign of a dependence on dust temperature, regardless of the model used to derive the dust emissivities. Thus, temperature mixing is not likely to be responsible, and we are confident that the emissivity changes are instead related to the intrinsic properties of dust grains.
4.2.3. Model parameters: A and lc
Unlike in Paradis et al. (2011a), we explored both cold and warm/hot regions of the Galaxy, to systematically investigate the variation in the TLS model parameters with environment.
Figure 8 shows the median values derived from this study for the lc and A parameters in the case of, respectively, the whole Galactic plane region covered by Hi-GAL and, the central and peripheral parts of the plane. We have also displayed, for comparison, the best-fit values deduced by Paradis et al. (2011a) for the solar neighborhood, for Archeops compact sources, and for the combination of both. In this analysis, the uncertainties in the parameters are assumed to be equal to their standard deviation. Since the error bars in the data are likely to be overestimated, as already discussed in Sect. 4.2.2, the parameters cannot be strongly constrained.
The distribution of points in the figure reveals that different environments are likely associated with different dust grain properties. From the fitting procedure discussed in Sect. 4.2.1, we estimated that the most representative values of lc and A for the Galactic plane are 7.5 nm and 11.0. For lc, this is close to the value derived for Archeops sources, but smaller than for the solar neighborhood. We also note (Fig. 1, panel D) that lc is globally characterized by values much lower than the standard one (lc,s = 13.4 nm). Both of these results are indicative of a less organized charge distribution for dust grains in the plane than for dust particles in the solar neighborhood. As for the amplitude of the TLS processes, A, this is larger by a factor of 1.9 in the Galactic plane than the standard value (As = 5.8). We note, however, that in the solar neighborhood, probed by FIRAS observations, and in Archeops compact sources, cΔ differs significantly from the standard value. Therefore, to be able to perform a proper comparison between these results, we needed to normalize A to cΔ,s = 475. Accordingly, we obtained A equal to 4.8 and 10.9 for, respectively, the solar neighborhood and the compact sources. Again, A in the Galactic plane is different from the value derived in the solar neighborhood. This result indicates that grains within the plane might have a larger degree of amorphization than in the solar neighborhood on the atomic scale, where the TLS processes occur.
The spatial variation across the Galactic plane of lc and A is provided in Fig. 2. Important variations in the two parameters, on both small scales (pixel to pixel) and large scales (from the central to the peripheral parts of the Galaxy), are visible. The A parameter exhibits high values in regions with significantly high e500 (especially in peripheral regions, see Fig. 3, panel C), which suggests that the excess does not depend on lc, but rather on A. This explains the large fluctuations in the lc parameter in the peripheral regions (see Fig. 2), which induce large standard deviations in the longitude profile of this parameter (see Fig. 3). In contrast, lc is more accurately characterized in regions of negative excess. In that latter case, variations in the spectral shape of the SEDs can only be accounted for by variations in the correlation length, since this parameter allows us to produce emission spectra with a spectral index larger than 2. This explains why the lc standard deviation is smaller closer to the Galactic center. The correlation between the 500 μm excess and the A parameter is shown in Fig. 9. Disorder in the grain structure on the atomic scale, i.e. the TLS part of the model, thus appears to be the main contributor to the emissivity variations at 500 μm. The lc parameter is indeed almost constant along the Galactic plane, as one can discern in Fig. 3 (panel D).
The A values (or excess values) are higher over most of the inner Galactic plane than in the solar neighborhood. If the origin of the variations is a general Galactic gradient, this would indicate that the solar neighborhood is an atypical place. It might also suggest that the spatial distribution of the excess is not described by simply an overall Galactic gradient but a more complicated structure.
The relation between A and lc is illustrated in Fig. 10. The plots are very noisy, especially for the whole and the peripheral regions of the Galactic plane. Nevertheless, they reveal a weak anti-correlation between the two parameters, which disappears at large values of A. We also see that, in the central regions of the Galactic plane, most of the points cluster in the region delimited by A ≃ 6 − 10, whereas the peripheral regions is rather accurately characterized by A ≃ 10 − 22. This shift in A is likely associated with variations in the dust properties, while the disappearance of the anti-correlation between A and lc confirms that spectral variations at wavelengths equal to or larger than 500 μm could be entirely due to variations in the intensity of the TLS process. A significant flattening of the spectra in the submm/mm domain is indeed expected if the TLS effects are responsible for the observed excess. We remind the reader, however, that longer wavelength observations are required to confirm the results obtained for this parameter. We note that the calibration uncertainty in the 500 μm measurement does not affect the spatial distribution of the TLS parameters. The calibration error would indeed only induce a variation in the absolute value of A. For instance, a decrease in the SPIRE 500 μm data by 7% would cause a corresponding decrease in A by a factor of 1.6, but the peripheral regions of the plane would still have the largest values of A. As for lc, its median value – and standard deviation – would be lower (lc ≃ 5.8 nm) than the regular median value (lc ≃ 7.5 nm), even if the change in the dust temperature is as small as 0.1 K. The difference of 1.4 K between the average dust temperature in the central and peripheral regions of the Galaxy would be preserved (see Sect. 4.2.2).
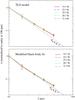 |
Fig. 7 Emissivity spectra in five bins of temperature and their 1-σ uncertainty, assuming temperature mixing along the LOS (with the use of the Dale et al. (2001) model): 19.1 K in red (solid), 22.3 K in dark blue (dash), 25.5 K in light blue (dot), 28.7 K in green (dash-dot), and 31.9 K in orange (dash-dot-dot). The emissivities have been computed for the best-fit TLS model (top panel) and a modified black body with β = 2 (bottom panel). An emissivity power-law in λ-2 is overplotted for comparison in continuous gray line. |
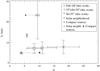 |
Fig. 8 Best-fit model parameters lc and A and their 0.5-σ standard deviations, derived from the TLS model for different Galactic environments. The arrows indicate values of the parameter to first order, when fixing cΔ to the standard value equal to 475. |
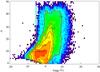 |
Fig. 9 A parameter derived from the TLS model as a function of the 500 μm emissivity excess. The overplotted contours, with levels at 50, 200, 350, 600, and 1000, represent the density of pixels. |
4.2.4. Relationship with the Galactic spiral arms
According to Greenberg & Li (1995), the spiral arms regions and the interarm regions might have different dust properties. This could explain the variations with Galactic longitude observed in the extinction data of Gao et al. (2009). The latter authors argued that these variations could be caused by the larger grains produced by coagulation, a higher dust density and a stronger radiation field in the spiral arms regions. Bernard et al. (2010) also showed the existence of warmer dust in regions of the LOS corresponding to the intersection with spiral arms. In Fig. 3, we have marked the tangent positions of the spiral arms taken from Vallée (2008) (l = −50°, –33°, –21°, and 31° for the Crux-Scutum, Norma, Perseus, and Scutum-Crux arms, respectively), as well as the position of the 3-kpc molecular ring defined in Dame & Thaddeus (2008) (|l| = 23°).
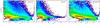 |
Fig. 10 Best-fit model parameters lc as a function of A, derived for the TLS model, across the entire Galactic plane (left panel), in the central (middle panel) and the peripheral regions of the Galactic plane (right panel). The overplotted contours represent the density of pixels, with levels at 100, 300, 800, and 1200 for all the Galactic plane and the central regions, and levels at 50, 100, and 300 for the peripheral regions of the Galactic plane. |
From Fig. 3, one can observe a direct link between the tangent positions of the spiral arms with some peaks in the dust temperature profile. Variations in the 500 μm emissivity excess linked to the arms are also visible but are less significant than the general trend with distance from the Galactic center. For the A parameter, the relationship with spiral arms is less obvious. A hint of a relationship can be discerned between the spiral arms and the correlation length, which is enhanced in these regions, although by an amount that is smaller than the standard deviation.
Variations in the optical properties predicted by the TLS model replace or are complementary to the predicted variations in emissivity caused by either aggregation or fluffiness. Dust growth is expected in dense molecular clouds, and aggregation likely produces both an increase in emissivity with respect to the gas column (for a given dust to gas ratio) and a decrease in dust temperature. The increase in the absolute emissivity with respect to the gas cannot be measured here because we do not directly compare the emissivity with the gas column density. From dipole discrete approximations calculations, the emissivity increase for aggregates is expected to be roughly constant in the range 100–500 μm. This does not change the spectral shape of the emissivity and cannot reproduce any significant 500 μm emissivity excess. Similarly, the changes in apparent dust temperatures are difficult to interpret in terms of aggregation at the scales analyzed here, and are probably determined mainly by variations in the local radiation field intensity, which may obscure any temperature decrease caused by dust aggregates.
5. Conclusions
We have performed an analysis of the emissivity variations along the Galactic plane using the newly released Herschel/Hi-GAL data (160 μm < λ < 500 μm) combined with the IRIS 100 μm data, at 4′ angular resolution. Changes in the emissivity spectra are interpreted in terms of the TLS model, which includes the DCD process characterized by a correlation length (lc), and the TLS effects, whose intensity (A) with respect to the DCD effect is left as free parameter. Our results can be summarized as follows:
-
A 500 μm emissivity excess, with respect to the predictions of amodified black-body model with β = 2, has been found in theperipheral parts of the Galactic plane (35° < |l| < 70°) covered by the data. Thisexcess can represent up to 16% to 20% of the total emission in some HIIregions.
-
The dust temperature, derived from the TLS model, appears to be slightly warmer in the central (by 1.4 K, for |l| < 35°) than the peripheral Galactic regions covered by the data. Regions near the Galactic center have temperatures in the range 18–25 K, whereas the median temperature across the rest of the Galactic plane covered is close to 18.6 K.
-
We have found a flattening of the emissivity spectra in the range 100–500 μm with increasing dust temperature. A model using a mixture of temperatures along the LOS has been used to verify wether this could be responsible for the observed behaviour. The results strongly suggest that the changes in the observed emissivity spectra with dust temperature cannot be accounted for by an LOS effect only, and that they must be caused instead by intrinsic variations in the dust properties with environment. These results are indeed compatible with the predictions of the TLS model with dust temperature, and suggest variations in the degree of amorphisation of the grains, i.e. the disorder at the atomic and/or nanometer scales.
-
The 500 μm emissivity excess can be explained by the intensity produced by the TLS processes. Indeed, the spatial variations in the A parameter (i.e. the amplitude of the TLS effects) follow the distribution of the excess.
-
Dust properties along the Galactic plane seem to differ from those of the solar neighborhood, the excess being smaller in the latter than expected from an extrapolation of the Galactic plane behavior.
-
The spatial distribution of lc (i.e. the correlation length of the DCD effect) does not present significant variations along the Galactic plane. Statistically, lc is three times lower than in the solar neighborhood, although it is close to the value obtained for compact sources.
-
Results in the framework of the TLS model indicate that dust grains are characterized by a degree of amorphization that is larger along the Galactic plane than in the solar neighborhood. In particular, the degree of amorphization tends to increase in the peripheral part of the plane covered by the Hi-GAL data. This work shows that specific variations in the mechanical structure of the material constituting the grains are likely to vary from the Galactic center towards the peripheral regions of the plane.
-
Variations in the dust temperature and the 500 μm emissivity excess as a function of Galactic longitude appear to correlate with the locations of Galactic spiral arms. In the context of the TLS model, this may suggest that changes in the mechanical structure of the grains occur in the spiral arms.
The combination of Planck and Herschel data will provide the opportunity to improve the current constraints on the dust properties.
Acknowledgments
We would like to thank the anonymous referee for his invaluable comments. D.P. acknowledges grant support from the Centre National d’Études Spatiales (CNES).
References
- Anderson, P. W., Halperin, B. I., & Varma, C. M. 1972, Phil. Mag., 25, 1 [NASA ADS] [CrossRef] [Google Scholar]
- Bennett, C. L., Bay, M., Halpern, M., et al. 2003, ApJ, 583, 1 [NASA ADS] [CrossRef] [Google Scholar]
- Benoît, A., Ade, P., Amblard, A., et al. 2002, Astropart. Phys., 17, 101 [NASA ADS] [CrossRef] [Google Scholar]
- Bernard, J.-P., Paradis, D., & Marshall, D. J. 2010, A&A, 581, L88 [NASA ADS] [CrossRef] [EDP Sciences] [Google Scholar]
- Compiègne, M., Abergel, A., Verstraete, L., et al. 2008, A&A, 491, 797 [NASA ADS] [CrossRef] [EDP Sciences] [Google Scholar]
- Compiègne, M., Flagey, N., Noriega-Crespo, A., et al. 2010, A&A, 724, A44 [Google Scholar]
- Compiègne, M., Verstraete, L., Jones, A., et al. 2011, A&A, 525, A103 [NASA ADS] [CrossRef] [EDP Sciences] [Google Scholar]
- Dale, D. A., Helou, G., Contursi, A., et al. 2001, ApJ, 549, 215 [NASA ADS] [CrossRef] [Google Scholar]
- Dame, T. M., & Thaddeus, P. 2001, ApJ, 683, L143 [Google Scholar]
- Désert, F.-X., Macías-Pérez, J. F., Mayet, F., et al. 2008, A&A, 481, 411 [NASA ADS] [CrossRef] [EDP Sciences] [Google Scholar]
- Dupac, X., Bernard, J.-Ph., Boudet, N., et al. 2003, A&A, 404, L11 [NASA ADS] [CrossRef] [EDP Sciences] [Google Scholar]
- Finkbeiner, D. P., Davis, M., & Schlegel, D. J. 1999, ApJ, 524, 867 [NASA ADS] [CrossRef] [Google Scholar]
- Galliano, F., Madden, S. C., Jones, A., et al. 2005, A&A, 434, 867 [NASA ADS] [CrossRef] [EDP Sciences] [Google Scholar]
- Galliano, F., Hony, S., Bernard, J.-P., et al. 2011, A&A, 536, A88 [NASA ADS] [CrossRef] [EDP Sciences] [Google Scholar]
- Gao, J., Jiang, B. W., & Li, A. 2009, ApJ, 707, 89 [NASA ADS] [CrossRef] [Google Scholar]
- Greenberg, J. M., & Li, A. 1995, in NATO ASI Conf. Proc. 469, The Opacity of Spiral disks, ed. J. I. Davies, & D. Burstein (Dordrecht: Kluwer), 19 [Google Scholar]
- Gordon, K., Galliano, F., Hony, S., et al. 2010, A&A, 518, L89 [NASA ADS] [CrossRef] [EDP Sciences] [Google Scholar]
- Griffin, M. J., Abergel, A., Abreu, A., et al. 2010, A&A, 518, L3 [Google Scholar]
- Hauser, M. G. 1993, in Back to the Galaxy, ed. S. S. Holt, & F. Verter (Melville, NY: AIP), AIP Conf. Proc. 278, 201 [Google Scholar]
- Li, A. 2005, AIP Conf. Proc., 761, 123 [Google Scholar]
- Malinen, J., Juvela, M., Collins, D. C., et al. 2011, A&A, 530, 101 [Google Scholar]
- Mathis, J. S., Mezger, P. G., & Panagia, N. 1983, A&A, 128, 212 [NASA ADS] [Google Scholar]
- Mény, C., Gromov, V., Boudet, N., et al. 2007, A&A, 468, 171 [Google Scholar]
- Miville-Deschênes, M. A., & Lagache, G. 2005, ApJS, 157, 302 [NASA ADS] [CrossRef] [Google Scholar]
- Molinari, S., Swinyard, B., Bally, J., et al. 2010a, PASP, 122, 314 [NASA ADS] [CrossRef] [Google Scholar]
- Molinari, S., Swinyard, B., Bally, J., et al. 2010b, A&A, 518, L100 [NASA ADS] [CrossRef] [EDP Sciences] [Google Scholar]
- Molinari, S, Bally, J., Noriega-Crespo, et al. 2011, ApJ, 735, 33 [NASA ADS] [CrossRef] [Google Scholar]
- Paladini, R., Montier, L., Giard, M., et al. 2007, A&A, 465, 839 [NASA ADS] [CrossRef] [EDP Sciences] [Google Scholar]
- Paradis, D., Bernard, J.-P., & Mény, C. 2009, A&A, 506, 745 [NASA ADS] [CrossRef] [EDP Sciences] [Google Scholar]
- Paradis, D., Veneziani, M., Noriega-Crespo, A., et al. 2010, A&A, 520, L8 [NASA ADS] [CrossRef] [EDP Sciences] [Google Scholar]
- Paradis, D., Bernard, J.-P., Mény, C., & Gromov, V. 2011a, A&A, 534, A118 [NASA ADS] [CrossRef] [EDP Sciences] [Google Scholar]
- Paradis, D., Reach, W. T., Bernard, J. Ph., et al. 2011b, AJ, 141, 43 [NASA ADS] [CrossRef] [Google Scholar]
- Pilbratt, G., Riedinger, J. R., Passvogel, T., et al. 2010, A&A, 518, L1 [CrossRef] [EDP Sciences] [Google Scholar]
- Phillips, W. 1972, J. Low Temp. Phys., 11, 757 [NASA ADS] [CrossRef] [Google Scholar]
- Phillips, W. 1987, Rep. Prog. Phys., 50, 1657 [CrossRef] [Google Scholar]
- Planck collaboration, 2011a, A&A, 536, A1 [NASA ADS] [CrossRef] [EDP Sciences] [Google Scholar]
- Planck collaboration 2011b, A&A, 536, A17 [NASA ADS] [CrossRef] [EDP Sciences] [Google Scholar]
- Planck collaboration 2011c, A&A, 536, A19 [NASA ADS] [CrossRef] [EDP Sciences] [Google Scholar]
- Planck collaboration 2011d, A&A, 536, A24 [Google Scholar]
- Planck collaboration 2011e, A&A, 536, A25 [NASA ADS] [CrossRef] [EDP Sciences] [Google Scholar]
- Poglitsch, A., Waelkens, A., Geis, N., et al. 2010, A&A, 518, L2 [NASA ADS] [CrossRef] [EDP Sciences] [Google Scholar]
- Reach, W. T., Dwek, E., Fixsen, D. J., & Hewagama, T., et al. 1995, ApJ, 451, 188 [NASA ADS] [CrossRef] [Google Scholar]
- Shetty, R., Kauffmann, J., Schnee, S., et al. 2009, ApJ, 696, 2234 [NASA ADS] [CrossRef] [Google Scholar]
- Schlömann, E. 1964, Phys. Rev., 135, 413 [NASA ADS] [CrossRef] [Google Scholar]
- Sodroski, T. J., Bennett, C., Boggess, N., et al. 1994, ApJ, 428, 638 [NASA ADS] [CrossRef] [Google Scholar]
- Stepnik, B., Abergel, A., Bernard, J. P., et al. 2003, A&A, 398, 551 [NASA ADS] [CrossRef] [EDP Sciences] [Google Scholar]
- Swinyard, B. M., Ade, P., Baluteau, J. P., et al. 2010, A&A, 518, L4 [Google Scholar]
- Tauber, J. A., Mandolesi, N., Puget, J. L., et al. 2010, A&A, 520, A1 [NASA ADS] [CrossRef] [EDP Sciences] [Google Scholar]
- Traficante, A., Calzoletti, L., Veneziani, M., et al. 2011, MNRAS, 416, 2932 [NASA ADS] [CrossRef] [Google Scholar]
- Vallée, J. P. 2008, AJ, 135, 1301 [NASA ADS] [CrossRef] [Google Scholar]
- Veneziani, M., Ade, P. A. R., Bock, J. J., et al. ApJ, 2010, 713, 959 [Google Scholar]
- Vinogradov, V. S. 1960, Fiz. Tverd. Tela, 2, 2622 (English transl 1961, Sov. Phys. Solid St. 2, 2338) [Google Scholar]
- Wright, E. L., Mather, J. C., Bennett, C. L., et al. 1991, ApJ, 381, 200 [NASA ADS] [CrossRef] [Google Scholar]
All Tables
All Figures
|
Fig. 1 Histograms of the 500 μm emissivity excess (panel A), results of the TLS modeling: the dust temperature (panel B), the A parameter (panel C) as defined in Eq. (5), and the lc parameter (panel D), as defined in Eq. (4). |
| In the text | |
|
Fig. 2 From left to right: 500 μm emissivity excess (in percent) and dust temperature derived from a modified black-body emission, and the results of the TLS modeling for dust temperature (TTLS) in K, intensity of the TLS processes (A), correlation length (lc) in nm, and reduced χ2. |
| In the text | |
|
Fig. 3 500 μm emissivity excess (panel A), dust temperature (panel B), A parameter (panel C), and lc parameter (panel D), as a function of Galactic longitudes. The dashed line shows the solar neighborhood value when normalized to cΔ,s = 475. The vertical error bars correspond to the 1-σ standard deviation. The blue arrows show the tangent directions of the spiral arms at l = −50°, –33°, –21°, and 31° (Vallée 2008) and of the 3 kpc ring at |l| = 23° (Dame & Thaddeus 2008). |
| In the text | |
|
Fig. 4 Temperature derived using the TLS model (TTLS), as a function of temperature derived from a modified black-body fit with β = 2 (Tfit). |
| In the text | |
|
Fig. 5 Average emissivity spectra in five bins of temperature and their 1-σ uncertainty: 16 K in red (solid), 20 K in dark blue (dash), 24 K in light blue (dot), 28 K in green (dash-dot), and 32 K in orange (dash-dot-dot). The emissivities have been computed using the best-fit with the TLS model (top panel) and with a modified black body with β = 2 (bottom panel). An emissivity power-law in λ-2 is overplotted as a continuous gray line, for comparison. |
| In the text | |
|
Fig. 6 Left panel: α parameter from the Dale et al. (2001) model. Right panel: reduced χ2 deduced from the comparison between data and the Dale et al. (2001) model. |
| In the text | |
|
Fig. 7 Emissivity spectra in five bins of temperature and their 1-σ uncertainty, assuming temperature mixing along the LOS (with the use of the Dale et al. (2001) model): 19.1 K in red (solid), 22.3 K in dark blue (dash), 25.5 K in light blue (dot), 28.7 K in green (dash-dot), and 31.9 K in orange (dash-dot-dot). The emissivities have been computed for the best-fit TLS model (top panel) and a modified black body with β = 2 (bottom panel). An emissivity power-law in λ-2 is overplotted for comparison in continuous gray line. |
| In the text | |
|
Fig. 8 Best-fit model parameters lc and A and their 0.5-σ standard deviations, derived from the TLS model for different Galactic environments. The arrows indicate values of the parameter to first order, when fixing cΔ to the standard value equal to 475. |
| In the text | |
|
Fig. 9 A parameter derived from the TLS model as a function of the 500 μm emissivity excess. The overplotted contours, with levels at 50, 200, 350, 600, and 1000, represent the density of pixels. |
| In the text | |
|
Fig. 10 Best-fit model parameters lc as a function of A, derived for the TLS model, across the entire Galactic plane (left panel), in the central (middle panel) and the peripheral regions of the Galactic plane (right panel). The overplotted contours represent the density of pixels, with levels at 100, 300, 800, and 1200 for all the Galactic plane and the central regions, and levels at 50, 100, and 300 for the peripheral regions of the Galactic plane. |
| In the text | |
Current usage metrics show cumulative count of Article Views (full-text article views including HTML views, PDF and ePub downloads, according to the available data) and Abstracts Views on Vision4Press platform.
Data correspond to usage on the plateform after 2015. The current usage metrics is available 48-96 hours after online publication and is updated daily on week days.
Initial download of the metrics may take a while.