Free Access
Fig. 9
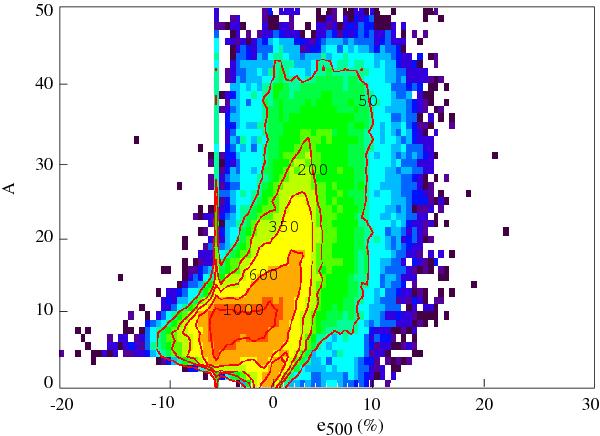
A parameter derived from the TLS model as a function of the 500 μm emissivity excess. The overplotted contours, with levels at 50, 200, 350, 600, and 1000, represent the density of pixels.
Current usage metrics show cumulative count of Article Views (full-text article views including HTML views, PDF and ePub downloads, according to the available data) and Abstracts Views on Vision4Press platform.
Data correspond to usage on the plateform after 2015. The current usage metrics is available 48-96 hours after online publication and is updated daily on week days.
Initial download of the metrics may take a while.