Fig. 3
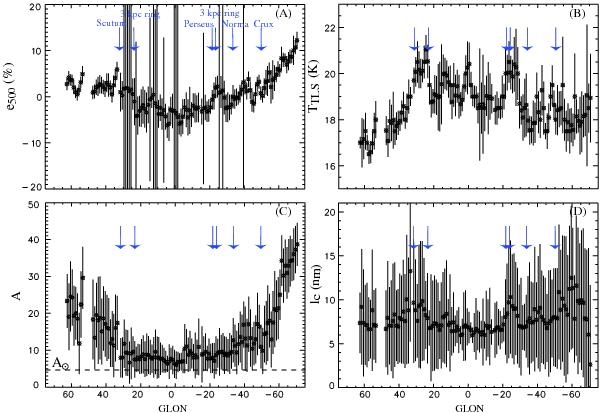
500 μm emissivity excess (panel A), dust temperature (panel B), A parameter (panel C), and lc parameter (panel D), as a function of Galactic longitudes. The dashed line shows the solar neighborhood value when normalized to cΔ,s = 475. The vertical error bars correspond to the 1-σ standard deviation. The blue arrows show the tangent directions of the spiral arms at l = −50°, –33°, –21°, and 31° (Vallée 2008) and of the 3 kpc ring at |l| = 23° (Dame & Thaddeus 2008).
Current usage metrics show cumulative count of Article Views (full-text article views including HTML views, PDF and ePub downloads, according to the available data) and Abstracts Views on Vision4Press platform.
Data correspond to usage on the plateform after 2015. The current usage metrics is available 48-96 hours after online publication and is updated daily on week days.
Initial download of the metrics may take a while.