Fig. 7
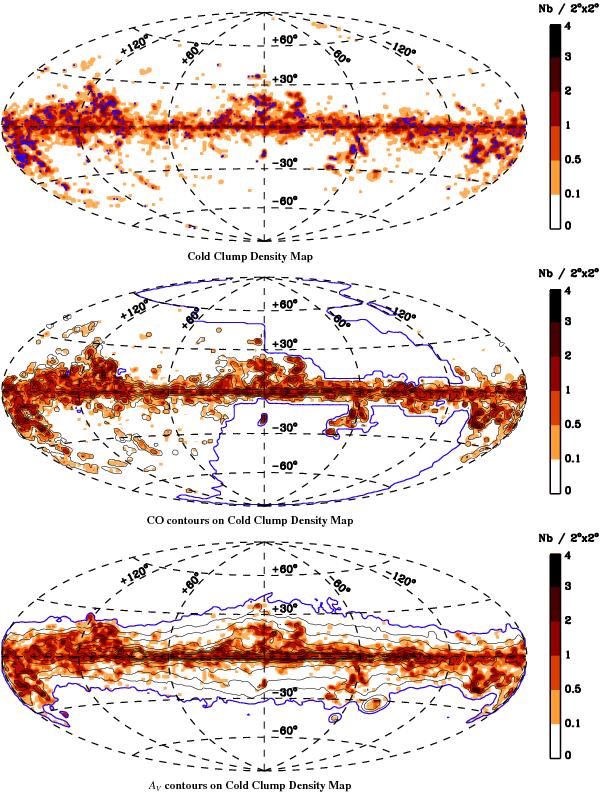
Upper panel: all-sky map of the number of C3PO Planck cold clumps per sky area (2° × 2°). The ECC sources are overlaid as blue squares. Middle panel: contours of 12COJ = 1 → 0) line emission (0.1, 1, 4, 10, 30 Kkms-1) are over-plotted on the C3PO density map, which is set to zero where the CO map is not defined (limited by the blue contours). The resolution of the CO map is 2°. Lower panel: visual extinction contours (AV = 0.1, 0.5, 1, 2, 3, 4, 5, 6, 7 mag) are over-plotted on the C3PO density map, which is set to zero where AV is lower than 0.1 mag (blue contours). The AV map is also at a resolution of 2°.


Current usage metrics show cumulative count of Article Views (full-text article views including HTML views, PDF and ePub downloads, according to the available data) and Abstracts Views on Vision4Press platform.
Data correspond to usage on the plateform after 2015. The current usage metrics is available 48-96 hours after online publication and is updated daily on week days.
Initial download of the metrics may take a while.