Fig.6
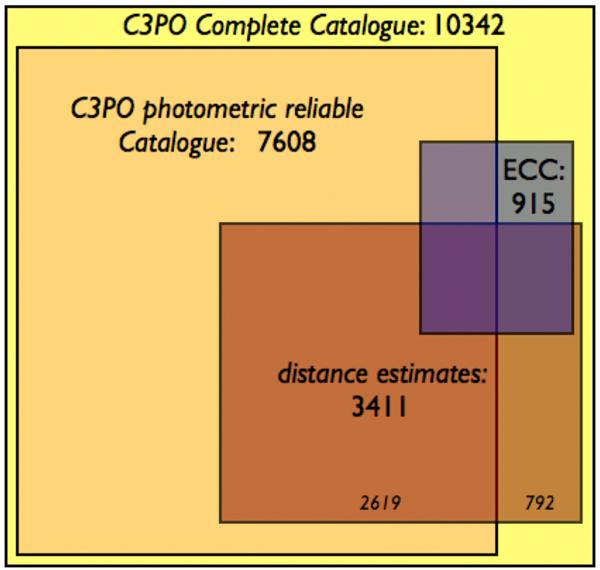
Partitioning of the two main C3PO samples: the complete (yellow) catalogue; and the photometrically reliable (orange) catalogue. The overlap between the sample for which we have distance estimates with those two catalogues is shown in brown. We finally overlay the ECC catalogue (blue) to show its overlap with the other samples. The proportional overlaps between samples are respected in this diagram.
Current usage metrics show cumulative count of Article Views (full-text article views including HTML views, PDF and ePub downloads, according to the available data) and Abstracts Views on Vision4Press platform.
Data correspond to usage on the plateform after 2015. The current usage metrics is available 48-96 hours after online publication and is updated daily on week days.
Initial download of the metrics may take a while.