Fig.3
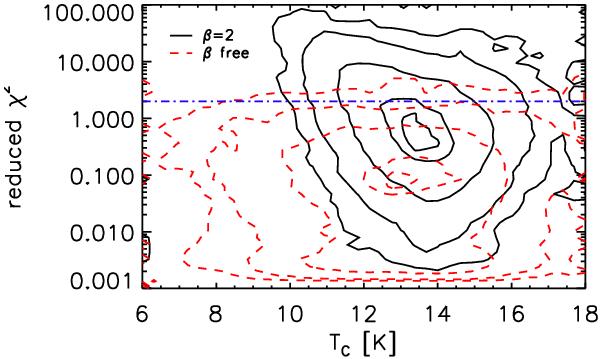
2D histogram of the reduced χ2 of the SED fitting as a function of the temperature Tc (see Sect. 4.1) for the photometrically reliable catalogue. The contours represent the 90%, 75%, 25%, 5% and 1% levels of the maximum of the 2D histogram over the (χ2, Tc) space. Case 1 (black solid line): reduced χ2 obtained for β = 2 as a function of the temperature inferred from the fit. When temperature becomes lower, more objects have a larger χ2. Case 2 (red dashed line): reduced χ2 as a function of the temperature obtained with a free β. The threshold χ2 = 2 (dash-dotted blue line) indicates the maximum level of χ2 that ensures a reasonable fit.
Current usage metrics show cumulative count of Article Views (full-text article views including HTML views, PDF and ePub downloads, according to the available data) and Abstracts Views on Vision4Press platform.
Data correspond to usage on the plateform after 2015. The current usage metrics is available 48-96 hours after online publication and is updated daily on week days.
Initial download of the metrics may take a while.