Fig. D.1
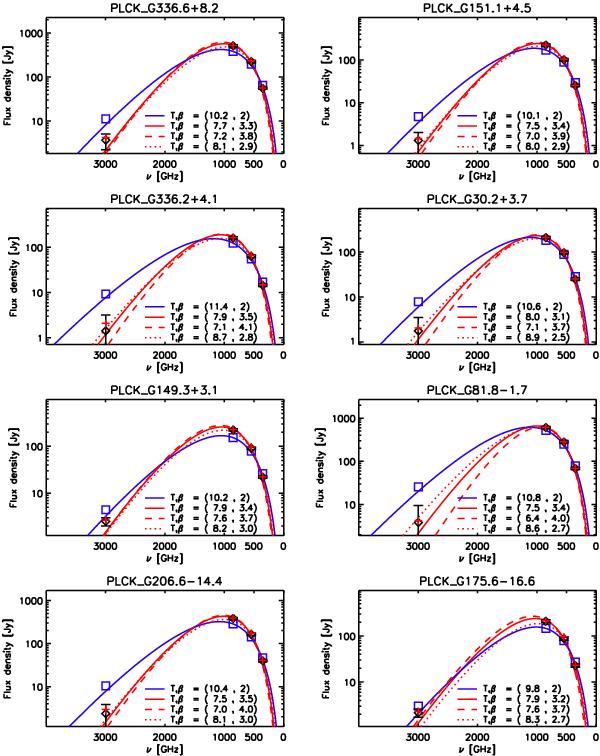
SEDs of selected C3PO sources with temperatures Tc < 8K. Black diamonds with error bars are the IRIS 3THz and Planck 857, 545 and 353GHz data. Two fits have been performed: one with β = 2 (blue); and the other with β free (red). For comparison with the data (black diamonds), the expected flux densities for the two fits, with the same colour convention, are shown with blue squares and red plus signs. The quality of each fit can be judged by comparing the estimated flux densities in each band, i.e., blue squares and red plus signs, with the actual measurements, i.e., black diamonds with error bars. Two models are overlaid to define an approximate error envelope in the case of β free: the (T + σT, β − σβ) modified blackbody emission model, in the red dotted curve; and the (T − σT, β + σβ) model in the red dashed curve.
Current usage metrics show cumulative count of Article Views (full-text article views including HTML views, PDF and ePub downloads, according to the available data) and Abstracts Views on Vision4Press platform.
Data correspond to usage on the plateform after 2015. The current usage metrics is available 48-96 hours after online publication and is updated daily on week days.
Initial download of the metrics may take a while.