Fig. 2
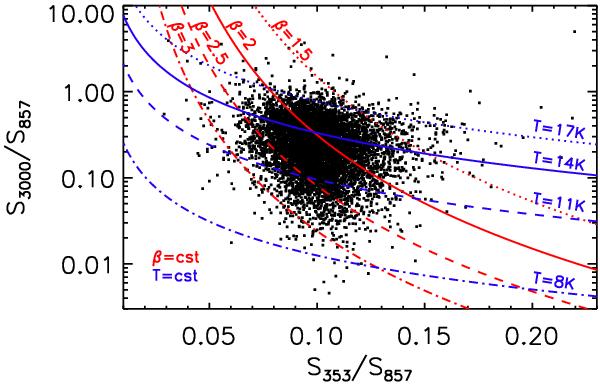
Colour–colour diagram of the photometrically reliable catalogue: flux density ratio S3000/S857 versus S353/S857. The red lines show the domain of the single modified blackbody emission models with fixed values of β. The blue lines show the domain of the single modified blackbody emission models for fixed values of the temperature. The locus β = 2 (red solid line) appears to be insufficient to fit all the observational data points (black dots) of the C3PO photometrically reliable catalogue.
Current usage metrics show cumulative count of Article Views (full-text article views including HTML views, PDF and ePub downloads, according to the available data) and Abstracts Views on Vision4Press platform.
Data correspond to usage on the plateform after 2015. The current usage metrics is available 48-96 hours after online publication and is updated daily on week days.
Initial download of the metrics may take a while.