Fig. 16
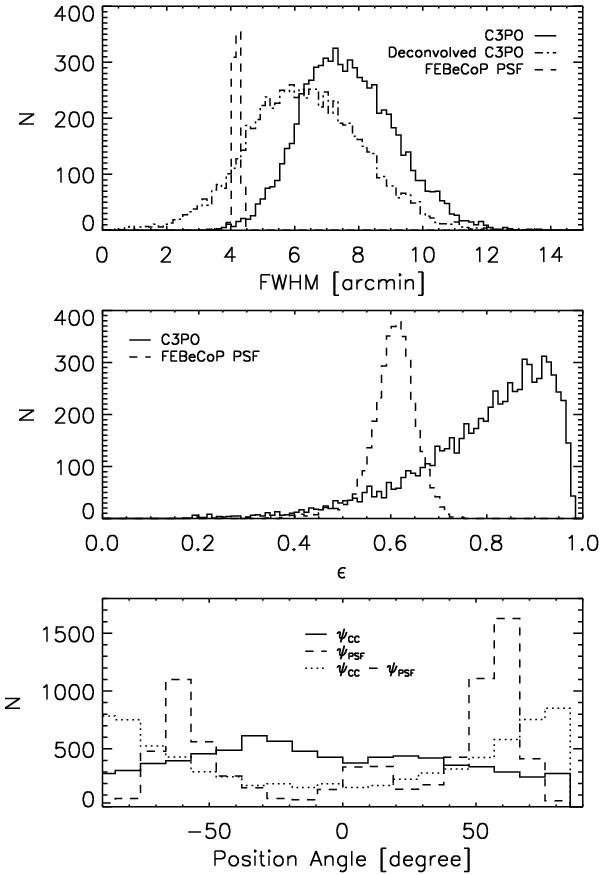
Upper panel: distribution of the FWHM of the Planck detections compared to the distribution of the local PSF at 857GHz (dashed line). Middle panel: distribution of the ellipticity of the cold clumps (solid line) and of the local PSF (dashed line). Lower panel: distribution of the position angle of the elliptical Gaussian of the clumps (solid line), of the local PSF (dashed line), and the difference between them (dotted line).
Current usage metrics show cumulative count of Article Views (full-text article views including HTML views, PDF and ePub downloads, according to the available data) and Abstracts Views on Vision4Press platform.
Data correspond to usage on the plateform after 2015. The current usage metrics is available 48-96 hours after online publication and is updated daily on week days.
Initial download of the metrics may take a while.