Fig. 15
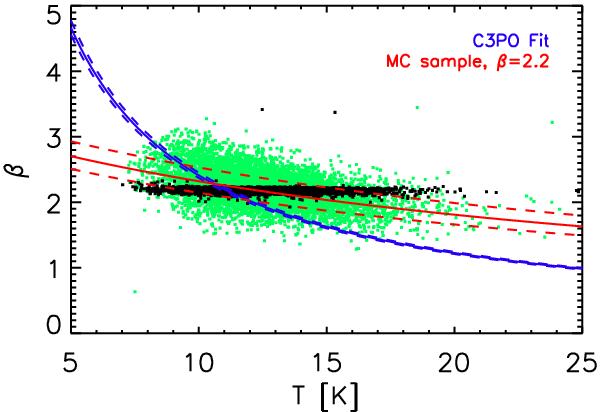
Monte Carlo analysis of the noise effects on the β(Tc) relation. The black dots correspond to a synthetic sample, where the source flux densities have been scaled to be consistent with a constant value of β. The green points show the Tc and β values extracted from data, where we have added to these flux densities the estimated observational noise. The red line is the fit to these points. The observed relation obtained using C3PO sources (blue line, cf. Fig. 14) is significantly steeper.
Current usage metrics show cumulative count of Article Views (full-text article views including HTML views, PDF and ePub downloads, according to the available data) and Abstracts Views on Vision4Press platform.
Data correspond to usage on the plateform after 2015. The current usage metrics is available 48-96 hours after online publication and is updated daily on week days.
Initial download of the metrics may take a while.