Fig. 13
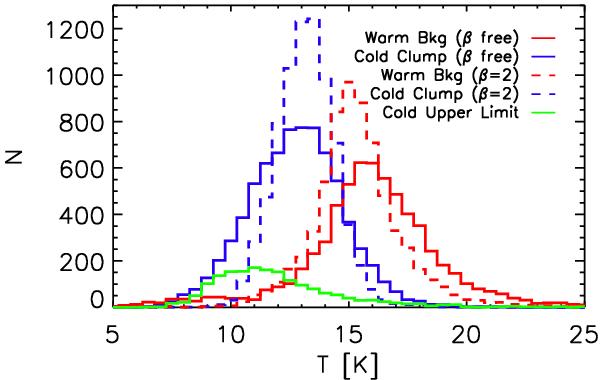
Distribution of the temperature of the cold clumps (blue) of the photometrically reliable catalogue and their associated warm background (red) estimated inside the elliptical Gaussian of the clump itself, when using a fixed spectral index β = 2 (dashed line) or a variable β (solid line). The green curve gives the distribution of the temperature estimates for the C3PO sources that present only an upper limit at 3THz. This temperature is then only an upper limit estimate, associated with a lower limit on the spectral index β.
Current usage metrics show cumulative count of Article Views (full-text article views including HTML views, PDF and ePub downloads, according to the available data) and Abstracts Views on Vision4Press platform.
Data correspond to usage on the plateform after 2015. The current usage metrics is available 48-96 hours after online publication and is updated daily on week days.
Initial download of the metrics may take a while.