| Issue |
A&A
Volume 536, December 2011
|
|
|---|---|---|
| Article Number | A62 | |
| Number of page(s) | 12 | |
| Section | Stellar atmospheres | |
| DOI | https://doi.org/10.1051/0004-6361/201015985 | |
| Published online | 08 December 2011 | |
Search for indications of stellar mass ejections using FUV spectra
1
Institut für Physik, IGAM, Karl-Franzens Universität Graz, Universitätsplatz 5, 8010 Graz, Austria
e-mail: This email address is being protected from spambots. You need JavaScript enabled to view it.
2
Institut d’Estudis Espacials de Catalunya/CSIC, Campus UAB, Facultat de Ciénces, Torre C-5 – parell – 2 a planta, 08193 Bellaterra, Spain
3
Space Research Institute, Austrian Academy of Sciences, 6 Schmiedlstrasse, Austria
Received: 23 October 2010
Accepted: 1 September 2011
Abstract
Aims. We search for highly energetic activity phenomena in a small sample of late-type main-sequence stars in the far ultraviolet (FUV) using data from the Far Ultraviolet Spectroscopic Explorer (FUSE).
Methods. Because FUSE allows a simultaneous photometric and spectroscopic analysis, we are able to analyze variations in the light curves (flares) and possible, activity-related signatures (line asymmetries, enhancements, and shifts) in the spectra. Furthermore, the computation of the well-known density-sensitive line ratio C iii(λ1176 Å)/C iii(λ977 Å) is also possible, and allows the investigation of its dependence on stellar activity.
Results. Three late-type main-sequence stars found in the FUSE archive (HD 36705, HD 197481, and Gl 388) show flares in their light curves. We find no obvious Doppler shifts in the brightest lines of these stars, but the O vi(λ1032 Å) transition region line of AD Leo shows a blue wing enhancement one spectrum after a flare event. This emission feature is shifted by ~–84 km s-1 from the line core. We can exclude that the spectral feature was caused by a gas cloud co-rotating with the star and favor an interpretation of a mass ejection. In addition we find an increase of the C iii(λ1176 Å)/C iii(λ977 Å) line ratio during all detected flares. We compare this finding to the Sun using solar full-disk spectra from the Thermosphere Ionosphere Mesosphere Energetics and Dynamics (TIMED) and SOlar Radiation and Climate Experiment (SORCE) missions, and find that powerful flare events also show an increased C iii(λ1176 Å)/C iii(λ977 Å) line ratio but this result is of low statistical significance. Owing to a lack of perfectly temporally coinciding TIMED/SORCE spectra and a low temporal resolution (~15 spectra per day) it is not possible to distinguish clearly if this increase is caused by the flares or by the related mass ejections.
Key words: stars: activity / stars: flare / stars: late-type / ultraviolet: stars / Sun: activity / Sun: transition region
© ESO, 2011
1. Introduction
Stellar activity in form of flares has been known since the 1940s on UV Ceti type stars, in the 70s flares were detected also in X-rays and today we know, thanks to sensitive instruments, that every star that holds a corona is also variable in X-rays. This phenomenon can be easily detected in light curves.
Stellar activity in form of plasma ejections is only indirectly detectable, which is more difficult than detections through direct observations. Indications of stellar mass ejections were detected several times in active M dwarfs as line asymmetries in Balmer lines (Houdebine et al. 1990; Fuhrmeister & Schmitt 2004), showing projected Doppler velocities of 100 and 5800 km s-1, respectively. A drop in the ultraviolet (UV) flux of the active M dwarf EV Lac lasting for 1.5 h was detected (Ambruster et al. 1986) during several hours of observations obtained by the International Ultraviolet Explorer (IUE). These authors interpreted the drop in UV line flux as a “major mass expulsion episode” caused by “obscuring material” reminiscent of solar prominences. Observations obtained by the Extreme UltraViolet Explorer (EUVE) of the young and fast rotating dM star AU Mic revealed a powerful flare with a decay time of a day. Cully et al. (1994) reconstructed the strongest spectral lines of AU Mic successfully by including the assumption of a an ejected magnetically confined plasma in their model. The deduced mass and kinetic energy of this event was a factor 10 000 higher than the strongest solar coronal mass ejections (CMEs). Katsova et al. (1999) applied a different model to the AU Mic event discussed in Cully et al. (1994) and concluded that the long-duration flare “ ... can be considered as a stellar analog of typical large solar flares with post eruptive energy release”. Several years later, Bond et al. (2001) presented observations obtained by the Hubble Space Telescope (HST) of the precataclysmic binary system V471 Tau, consisting of a cool dK star and a hot white dwarf. Two episodes of sudden transient absorption features were detected in the S iii(λ1206 Å) line. These features were suggested by the authors to be the signatures of CMEs from the dK star crossing the line of sight to the white dwarf. The deduced frequency of the events exceed the solar CME parameters by a factor of >100.
List of characteristics of AB Dor, AU Mic, and AD Leo.
Various observational signatures (line asymmetries, UV dimmings, and long flare decay times) can be attributed to stellar CMEs. CMEs cause density fluctuations (Kathiravan & Ramesh 2005) because they propagate through the stellar atmosphere. Spectral line ratios sensitive to the electron density, such as the C iii(λ1176 Å)/C iii(λ977 Å) line ratio, provide information on the variation of electron density in the region from where these lines originate. Dupree et al. (1976) found that the ratio is enhanced for active solar regions. On stars, this ratio was found to be enhanced during flaring (Bloomfield et al. 2002; Christian et al. 2006). The C iii(λ977 Å) transition region line shows a significant increase in flux during solar CMEs, as shown by Ciaravella et al. (1997) from observations with the Ultra Violet Coronograph Spectrometer onboard the SOlar Heliospheric Observatory (UVCS/SOHO). Whether this line ratio is affected by solar CMEs and if it could therefore be used as a diagnostic for stellar CMEs remains unclear.
Knowledge of stellar CME parameters is of high interest for stellar mass and/or momentum loss studies and non-thermal planetary mass loss studies, which investigate the influence of high-energy particle impacts on planetary atmospheres. It has been shown (Grießmeier et al. 2005; Khodachenko et al. 2007) that the combination of a close-in orbit, frequent CME impacts, and a weak planetary magnetic field, unable to protect the planet against high-energy particles, can lead to the total erosion of the planetary atmosphere. In addition, Lammer et al. (2007) found that if the magnetosphere of an exoplanet is compressed by CMEs and the stellar wind, the exospheric gas can be easily eroded. Therefore information on the frequency, mass, velocity, and kinetic energy of stellar mass ejections is crucial for models that simulate the influence of high-energy particles on planetary atmospheres. Furthermore, because stellar CMEs and flares (or the stellar XUV radiation environment) severely influence the planetary atmospheric mass loss, these phenomena also influence the habitability of a planet and consequently the existence of a biosphere, which can only last for long times within a stable planetary atmosphere.
In the current study we search the data archive of the Far Ultraviolet Spectroscopic Explorer (FUSE) for late-type main-sequence stars. In total we find 24 stars. We analyze FUSE light curves of these stars and detect flares on AU Mic, AB Dor, AD Leo, and AR Lac. Because we are only interested in the activity signatures of single stars, we analyze only the data of AU Mic, AB Dor, and AD Leo (for characteristics and observational information of these stars see Tables 1 and 2). In these stars we look for spectral line-asymmetries, -enhancements and Doppler shifts, which could be related to stellar mass motions. In addition we calculate the C iii(λ1176 Å)/C iii(λ977 Å) line ratio for these stars and compare the results to solar values, to study the correlation to flares and CMEs.
The stellar data that are analyzed in this study are public archived data and were already published. In Sect. 3 where we present and describe stellar lightcurves and spectra, we refer also to the relevant previous studies (for AU Mic: Bloomfield et al. 2002; Del Zanna et al. 2002, for AD Leo: Christian et al.2006; and for AB Dor: Dupree et al.2006), in which flare detections and values for the C iii(λ1176 Å)/C iii(λ977 Å) line ratio during stellar quiescence and activity have already been presented (except for the AB Dor data set, for which no values for this line ratio have been published so far). In contrast to previous studies we investigate the temporal evolution of the flare lightcurves in greater detail and perform a systematic search for spectral line shifts and enhancements. Moreover, we reinvestigate the stellar C iii(λ1176 Å)/C iii(λ977 Å) line ratio in more detail and present a comparative analysis of the solar C iii(λ1176 Å)/C iii(λ977 Å) line ratio during different stages of solar activity.
2. Observations and data processing
In the current study we analyze a set of FUSE observations. FUSE operates in the far ultraviolet (FUV) region of 905–1187 Å using four apertures (PINH, HIRS, MRWS, LRWS), two different coated mirrors (LiF, SiC) and four detector segments (1a, 2a, 1b, 2b) for each mirror. FUSE provides FUV spectroscopy with a spectral resolution of 0.013 Å. For a detailed description of the mission see Moos et al. (2000).
All observations were performed using the large aperture (LWRS). The data sets were retrieved from the Multimission Archive at Space Telescope (MAST1) as raw data files. The calibration of the raw data was performed through the FUSE calibration pipeline CalFuse; we are using CalFuse v3.2. This gives us the opportunity to analyze the intermediate data files (IDF) separately, which are processed through the calibration steps of the pipeline. The IDF were then used for the extraction of light curves with the option of screening the files using time- and location-flags. For the calibration itself we used the common calibration steps by the pipeline. We selected night-time data only for the analysis to minimize the influence of geocoronal emission. The spectral information was taken from the calibrated data.
List of observational characteristics of the three flare stars of this study.
2.1. Correction for ISM absorption
For the computation of the C iii(λ1176 Å)/C iii(λ977 Å) flux ratio we had to correct for absorption by the inter stellar medium (ISM) of the C iii(λ977 Å) transition region line because it corresponds to a ground-state transition. Wood et al. (2005) investigated ISM and astrospheric absorption in Lyα profiles of more than 60 late-type stars. These authors showed that the ISM absorption in Lyα is much stronger than the astrospheric absorption. We expect the same to be true for the C iii(λ977.02 Å) line, therefore we consider a correction for ISM absorption (and not wind absorption) in this emission line. Because direct ISM measurements are not reliable owing to the low S/N ratio of the FUSE spectra (only averaging over several files reveals the ISM absorption profiles), we used the method by Guinan et al. (2003). These authors made use of ISM investigations and models by Redfield & Linsky (2002) together with local ISM abundances from Wood et al. (2002) and Redfield & Linsky (2000). For AB Dor and AU Mic we found direct column density measurements from Redfield & Linsky (2002). For AD Leo we used direct column density measurements from Wood et al. (2005). From the measured column densities of Mg ii (taken from Redfield & Linsky 2002) we calculate, together with the local ISM abundance log(Mg ii/H i) ~ –5.58 (taken from Wood et al. 2002), the column density of H i. Using the local ISM abundance log(C ii/H i) ~ –3.66 (taken from Wood et al. 2002) and the calculated column densities of H i, we can calculate the column density of C ii. Now using the local ionization fraction of carbon in the ISM (Wood et al. 2002, C ii/C iii ~ 0.02) we compute the C iii column density.
Together with the Doppler parameter (taken from Redfield & Linsky 2002; Wood et al. 2005) we are able to compute the equivalent width, which we compute via the “curve of growth” method, and the optical depth. This leads us finally to the amount of absorbed stellar flux. For AB Dor we find an amount of absorbed flux in the range of 1–16%, for AD Leo 17–37%, and for AU Mic 21–30%. The correction for ISM absorption of the C iii(λ977.02 Å) line uses data of the SiC1b channel, except for AU Mic, for which we used data of the SiC2a channel, because data of the SiC1b channel show corrupted C iii(λ977.02 Å) profiles.
3. Results
3.1. Lightcurve analysis
The FUSE wavelength range provides three strong stellar emission lines, which are the C iii(λ977.02 Å) singlet, the C iii(λ1176 Å) multiplet, and the O vi(λ1031.9 Å, λ1037.2 Å) doublet, respectively. Because FUSE spectra are contaminated by geocoronal emission (airglow), we used narrow wavelength windows centered around these lines for the extraction of the lightcurves.
The selected wavelength windows are 1031–1033 Å for the O vi(λ1032 Å) line, 1174–1177 Å for the C iii(λ1176 Å) line, and 976–978 Å for the C iii(λ977 Å) line.
As reported in previous publications of these data sets, AD Leo shows two distinct flares (Christian et al. 2006), AU Mic (Bloomfield et al. 2002) shows one flare, and AB Dor (Dupree et al. 2006) shows three flares, two of which appear during observational day-time and are therefore not considered for further analysis. In Fig. 1 we show flare light curves of the C iii(λ1176 Å) line of all three stars. The flare light curves of AB Dor, AU Mic, and AD Leo I show a steep increase and a slower decaying tail of stellar C iii(λ1176 Å) luminosity, whereas the flare lightcurve of AD Leo II shows a symmetrical shape with a steep increase and a fast decrease of luminosity.
We derive flare energies for all flares by integrating over the lightcurve and then subtracting the quiescent contribution of the lightcurve (see Table 3). AU Mic and AB Dor show flares of nearly the same energy, while the flare energies of AD Leo are about an order of magnitude lower.
Flare energies (quiescent level is subtracted) for all stars in the three studied lines.
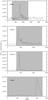 |
Fig. 1 Shown are all flare events on AB Dor (upper panel: lightcurve of exposure No. 9 is shown), AD Leo (middle panels: lightcurves for exposures Nos. 37 and 52 are shown), and AU Mic (lower panel: lightcurve of exposure No. 9 is shown) in the light of the C iii(λ1176 Å) multiplet, in which the flares are most pronounced. The peak luminosities of the flares on AB Dor and AU Mic are a factor ten higher than for the AD Leo flares. The overlayed gray-shaded areas correspond to observational night-time. |
3.2. Spectral analysis
For the identification of stellar emission lines we made use of the results of previous investigations (Guinan et al. 2003; Ake et al. 2000; Young et al. 2001; Del Zanna et al. 2002) in which detailed and precise analyses have been performed. The two M stars show similar line fluxes of the strongest emission lines (C iii and O vi) and the single components of the C iii multiplet are resolved. These strong emission lines are not significantly broadened. AB Dor shows broad line profiles, the components of the C iii multiplet are unresolved, and the C ii(λ1036 Å) line is blended with the O vi(λ1037 Å) line. The broadening of the lines in the AB Dor spectra is caused by its short rotation period of 0.51 d. AD Leo and AU Mic have rotation periods of 2.24 and 4.81 days, respectively, resulting in relatively unbroadened lines.
The profiles of the strongest spectral lines (C iii(λ1176 Å), C iii(λ977 Å), O vi(λ1032 Å), O vi(λ1037 Å), Lyβ(λ1024 Å)) of all three stars were investigated regarding possible asymmetries and we shortly discuss them below. Because the FUSE spectra of these stars are already discussed by other authors, we will shortly summarize their analyses and in addition show the averaged quiescent profiles of Lyβ and O vi(1032 Å). The spectral profiles of AB Dor The spectral series of AB Dor contains 30 (observation Nos. 1–30) spectra with exposure times of 1800–2100 s except for three spectra with exposure times below 1000 s (after screening). AB Dor shows an averaged quiescent Lyβ profile (see middle panel of Fig. 2) with a small broadened red part of the profile. Additionally, the wings of the Lyβ profile are symmetrically broadened. The O vi(λ1032 Å) spectral profile clearly shows a broader blue part of the profile (see middle panel of Fig. 3) with again broadened wings. Dupree et al. (2006) discuss and show the O vi(1032 Å) profiles of the same FUSE data set as presented herein. These authors find, from the spectral information over three rotational periods of the data set, that the “modulation of the line flux with phase is most pronounced in the O vi(λ1032) line ...”. Dupree et al. (2006) assigned the observed asymmetries in the non-flaring O vi(1032 Å) spectra to “spectra when active regions are present”. The C iii lines again show no significant asymmetries, and we detect the Fe xviii(λ975 Å) line in only two spectra (Nos. 15 and 25). The spectral profiles of AU Mic The spectral series of AU Mic contains nine (observation Nos. 1–9) spectra with exposure times of 1488–1830 s (after screening). The only flare spectrum of the series is spectrum No. 9. Del Zanna et al. (2002) analyzed the same data set and termed the increase in ct/s of exposure 9 of the AU Mic data a transition-region explosive event similar to events found in Robinson et al. (2001) and Ayres et al. (2001). The profiles of AU Mic show only small asymmetries. The Lyβ line exhibits a Gaussian shape throughout the series. In the lower panel of Fig. 2 the averaged quiescent Lyβ profile shows an enhanced blue wing, possibly related to continuous plasma outflow. The O vi(1032 Å) profile exhibits a weak red wing asymmetry (see lower panel of Fig. 3), except during the flare (spectrum No. 9), where a broader red wing is visible (cf. Fig. 4 in Bloomfield et al. 2002). The carbon ion lines appear without significant asymmetries as in the case of AD Leo, and the Fe xviii(λ975 Å) line is seen in the mean spectrum (comprised of all exposures) of AU Mic (cf. Fig. 2 in Redfield et al. 2003). The spectral profiles of AD Leo The spectral series of the FUSE AD Leo data contains 41 (observation Nos. 14–54) spectra with exposure times (after screening) of several hundreds up to nearly 2000 s. The flare spectra of this series are spectra No. 37 (see Fig. 4 upper leftmost spectrum) and No. 52. The spectral Lyβ profile of AD Leo appears generally asymmetric (see upper panel of Fig. 2), with a broad red wing and a steep increase of the line on the blue side. At spectrum No. 38 the profile returns to a Gaussian shape by an emerging component on the blue side of the line. This component is present in nearly all spectra with a maximum at spectrum No. 38. Nearly all O vi(λ1032 Å) profiles are symmetric (see upper panel of Fig. 3) and can be fitted by single Gaussians. In some cases double Gaussians are needed to fit the symmetrically broadened wings. Spectrum No. 37 (flare spectrum) shows a red wing enhancement and spectrum No. 38 shows a distinct blue wing enhancement. The second component of the O vi doublet can also be fitted by single and double Gaussians, and shows weak red wing broadenings at the end of the spectral time series. The carbon ion lines show no obvious asymmetries. The Fe xviii(λ975 Å) line is present in the SiC1b channel.
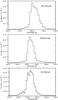 |
Fig. 2 Averaged quiescent spectral profiles of the Lyβ line detected in the FUSE observations of AD Leo, AB Dor, and AU Mic. The Lyβ profile of AD Leo is asymmetric with a broader profile on the red side, whereas the AB Dor profile shows a weaker red asymmetry. AU Mic completes the sample with a Gaussian profile with a small but distinct extra emission in the blue wing. The spectra were extracted from the LiF1a channel and represent night-time observations only. |
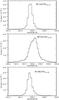 |
Fig. 3 Averaged quiescent spectral profiles of the O vi(1032 Å) line detected in the FUSE observations of AD Leo, AB Dor, and AU Mic. The O vi(1032 Å) profile of AD Leo shows a Gaussian shape, whereas the profile of AB Dor shows an asymmetric profile with a broad blue component. The spectrum of AU Mic exhibits a weak red wing asymmetry. The spectra were extracted from the LiF1a channel and represent night-time observations only. |
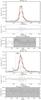 |
Fig. 4 O vi(λ1032 Å) spectra, residuals, and lightcurves Nos. 37 and 38 of the FUSE time series of AD Leo. During spectrum No. 37 a flare happened in AD Leo (see Fig. 1), whereas the corresponding lightcurve of No. 38 shows no variation although we detect a higher mean countrate which possibly indicates that exposure No. 38 belongs to the decaying tail of the flare. Both line profiles differ from the quiescent profile of O vi(λ1032 Å). The line wings in both spectra are broader than in the quiescent case, profile No. 37 shows a red wing enhancement, whereas No. 38 shows a distinct blue wing enhancement, which is shifted by − 84 km s-1 (measured from maximum to maximum of the left-most fit to the line center of O vi(λ1032 Å)). A multi-Gaussian function was used to fit the observed profile. The red solid line represents the multi-Gaussian fit, whereas the thin black solid lines represent the single Gaussian components of the fit. The exposure time (after screening) for exposure No. 37 was 2020 s and for exposure No. 38, 1186 s. |
Because the FUSE observations used in this study were performed in “time tagged“ mode (data are stored as photon lists, with assigned characteristics), we were able to analyze flare spectra, which were classified from the corresponding light curves. The main interest is dedicated to those spectra, because we are interested in the effect of stellar flaring or possible plasma motions on the spectra.
All of the flare spectra of our sample stars show a clear flux enhancement compared to their respective quiescent spectra. No obvious blue shifts are detected in the flare spectra. The calibrated FUSE spectra used in this study were binned over five wavelength intervals. Because the original spectral resolution of FUSE is 0.013 Å, our resolution decreases to 0.075 Å. For the investigation of total line shifts (shift of the whole spectra line) of the brightest spectral lines in the FUSE data (C iii(λ1176 Å), C iii(λ977 Å), and O vi(1032, 1037 Å)) we overplotted the flare spectra and averaged the quiescent spectra. Because we rebinned the data to increase the signal to noise ratio, we obtained lower limits for the line shifts of 19.1 km s-1 for C iii(λ1176 Å), 23 km s-1 for C iii(λ977 Å), and 21.8 and 21.7 km s-1, respectively for O vi(1032, 1037 Å). None of the profiles of the carbon and oxygen lines of AD Leo, AB Dor, and AU Mic show total line shifts above these thresholds.
From an analysis of the FWHM of the O vi(λ1032 Å) line profiles of AD Leo, which were fitted with single Gaussians, we found that spectrum No. 38, which follows the flare spectrum No. 37 (see Fig. 4), shows the maximum FWHM of the whole spectral series. In this spectrum we detected a distinct emission feature in the blue wing of O vi(λ1032 Å) (henceforth termed ALE – AD Leo Event), which can be fitted by an additional Gaussian. Therefore the whole line must be fitted with three Gaussians for the best reproduction of the original line profile. The maximum of the leftmost component is blue-shifted by − 84 km s-1 relative to the component of the main line (see Fig. 4). This velocity value is on the order of continuous solar coronal plasma motions (100 km s-1Ciaravella et al. 2005) or rise velocities of solar filaments (Chen et al. 2005). Although the velocity is low compared to typical solar CME velocities, this blue-shifted feature could be related to a shock-wave or a mass expulsion, because we probably only see a projected velocity. Because spectrum No. 38 reveals a distinct emission feature, a closer inspection of the data of exposure No. 38 was performed to exclude a contribution of non-stellar sources. At first we compared the O vi(λ1032 Å) emission line from all available segments and channels (LiF1a, LiF2b, SiC1a, SiC2b). This comparison showed that in no other segment/channel the feature appears as distinct as in LiF1a. The corresponding SiC2b channel shows spike like emission instead of a smooth emission feature. The SiC1a channel indicates an emission feature, but not distinctly. The LiF2b channel also shows a different profile but at the location of the emission feature detected in LiF1a we see an enhancement. We investigated the wavelength region of the emission feature in all exposures and found that in channels LiF1a, LiF2b, and SiC1a, the flux in this region is highest in exposure No. 38, except for channel SiC2b (spike-like emission), where we were unable to find a maximum for exposure No. 38. Especially the spectra of channel SiC2b show noisy spectra.
The time-tagged mode of FUSE allows the screening for different event characteristics such as the pulse height. The FUSE detectors convert photons to showers of electrons, and store among other parameters the total charge or pulse height of the showers (Dixon et al. 2007). The pipeline sets minimum and maximum values in the pulse height screening. We investigated how the spectrum No. 38 varies for different pulse height minima and maxima by modifying the calibration files and recalibrating the raw data file. The minimum and maximum values set by the pipeline are 2 and 25. We used four these ranges (3–16; 2–20; 4–20; and 4–23) and found that ALE is not affected by the variation of the pulse height maxima and minima in the pulse height screening.
3.3. Stellar C iii(λ1176 Å)/C iii(λ977 Å) line ratio
In the early seventies, Munro et al. (1971) presented a method for estimating electron densities using an emission line ratio (C iii(λ1176 Å)/C iii(λ977 Å)) in the UV. Dupree et al. (1976) investigated this ratio in the quiet Sun and in a sunspot. The authors found that the ratio is enhanced over an active region. The density sensitivity of the ratio arises from C iii(λ1176 Å), which is excited from a metastable level in contrast to C iii(λ977 Å), which is excited from the ground state. Only the population of the C iii(λ1176) transition depends on electron density, therefore the ratio can increase with increasing electron density. Both transitions are excited by electron collisions. Electron density derived from this ratio is valid for optically thin plasmas over a density range of 108–1011 cm-3 (Dupree et al. 1976).
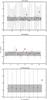 |
Fig. 5 Variations of the C iii(λ1176 Å)/C iii(λ977 Å) line ratio of AD Leo, AB Dor and AU Mic. Flare spectra are marked by red asterisks. All three stars exhibit an enhanced line ratio during flares. The gray shaded areas correspond to the quiescent mean line ratios ± measurement uncertainty. All line ratio enhancements of the current study are correlated with stellar flares, as can be seen for AD Leo (upper panel), AB Dor (middle panel) and AU Mic (lower panel). In the middle panel we see another distinct line ratio enhancement (No. 15). During exposure No. 15 a flare occurred during observational day-time. The night-time data of exposure No. 15 are still affected by the flare, causing the increase of the line ratio. |
Redfield & Linsky (2002) and Del Zanna et al. (2002) investigated FUV spectra of young and active stars and found C iii(λ1176 Å)/C iii(λ977 Å) flux ratios beyond the density limit. Both authors state that the C iii(λ1176 Å)/C iii(λ977 Å) flux ratio is not a useful tool to deduce the electron density for active stars because the electron density in these stars is higher than the applicable range of the ratio. Both authors put the physical significance of the line ratio for active stars in question because of the temperature and opacity effects. There seem to be deviations from the optically thin assumption for active stars. Bloomfield et al. (2002) and Christian et al. (2006) investigated opacity in the transition regions of AU Mic and AD Leo, respectively. Both authors used the same FUSE data sets as we did and found deviations from the optically thin limit for the C iii(λ1176 Å) multiplet line ratios. Bloomfield et al. (2002) found a C iii(λ1175.7 Å)/C iii(λ1174.9 Å) line ratio of 2.18 in AU Mic during quiescence and 1.32 during flaring. Christian et al. (2006) found a similar ratio for AD Leo of 2.24 during stellar quiescence and a ratio of 1.19 during stellar flaring. For the O vi line both stars show no deviation from the optically thin assumption. For deducing electron densities from the C iii(1176 Å)/C iii(977 Å) line ratio only lower limits can be set. However, caution has to be taken when attempting to deduce electron densities from this line ratio for active stars.
Bloomfield et al. (2002) and Christian et al. (2006) estimated percentages of flux of the C iii lines lost owing to opacity. This gives the opportunity to investigate in which way the line ratio changes if we correct for opacity effects. Both authors note that opacity effects exist for the quiescent and flaring cases. Bloomfield et al. (2002) give percentages of lost flux for the flaring cases of AU Mic for the C iii(λ1176 Å) and C iii(λ977 Å) lines, of 40 and 82%, respectively. No percentages are given for the quiesent fluxes of AU Mic. If we consider these opacity effects in the computation of the C iii ratio, we obtain 0.93 ± 0.073. The given error should be seen as a lower limit because it does not include the error from the opacity correction which was not given by Bloomfield et al. (2002). However, although we cannot compute the quiescent C iii fluxes corrected for opacity effects, one can see that the corrected value during flaring for AU Mic still exceeds the quiescent mean value (not corrected for opacity effects) of 0.62 ± 0.15. Because the quiescent fluxes are also affected by opacity they should be lower. Even if we consider opacity effects, the C iii line ratio is still higher during flaring than during quiescence.
All stars of this study show an enhanced C iii(λ1176 Å)/ C iii(λ977 Å) ratio (see Fig. 5) during flaring. This was previously recognized for the AD Leo and AU Mic FUSE data (Christian et al. 2006; Bloomfield et al. 2002). The ratio for all stars is significantly above the solar values given in Dupree et al. (1976), which were obtained from a small solar region and not from the entire solar disk. Stellar spectra include information from the whole stellar disk, i.e. from quiet and active regions. Therefore the ratio should be higher in the stellar case or when measuring the line ratio from solar irradiance measurements (see Sect. 3.4). For young and active stars the ratio seems to be increased, as studies of Bloomfield et al. (2002) and Christian et al. (2006) have shown. Moreover, Guinan et al. (2003) found that the line ratio decreases with stellar age for solar-like stars. The mean line ratios (generated from all exposures of the time series excluding flare exposures) for the three stars of the present study are 0.8 ± 0.13 for AD Leo, 0.7 ± 0.13 for AB Dor, and 0.62 ± 0.15 for AU Mic. These ratios differ from the values for AD Leo in the study of Christian et al. (2006) because of the difference in measuring the line fluxes (Christian et al.2006: integration over a line fit – current study: integration over the original line profile) and because we are considering the ISM absorption.
In Fig. 5 we show the time series of the C iii(λ1176 Å)/ C iii(λ977 Å) ratio including flaring and quiescence spectra for all three stars. Black asterisk symbols correspond to quiescent ratios of single exposures and red asterisk symbols correspond to flare ratios. The total errors are computed using the Gaussian error propagation, considering measurement uncertainties of the C iii(λ1176 Å) and C iii(λ977 Å) fluxes, provided by FUSE. Because we used exposures from one segment/channel (LiF1a, LiF1b, SiC1b and SiC2a, respectively), the errors are high for AD Leo and AU Mic. The gray shaded area in Fig. 5 shows the mean line ratio with corresponding errors. The mean line ratio was computed by first merging all IDF files from one segment/channel after combining the bad pixel maps and then extracting the wavelength and flux vectors (see the IDF Cookbook2). The measurement uncertainties and the fluxes were taken and estimated from the merged file.
We also considered the influence of the interstellar absorption on the ratio, because C iii(λ977 Å) is distinctly affected by interstellar absorption. The C iii(λ977 Å) fluxes were corrected by the percentages given in Sect. 2.1.
The AD Leo line ratios show two distinct enhancements (Nos. 37 and 52), which can be assigned to flare events in the data. AU Mic shows one distinct enhancement (No. 9), which also can be assigned to a flare event. The line ratios of AB Dor show two distinct enhancements from which the first (No. 9) can be assigned to a flare. The second enhancement (No. 15) is also related to a flare that occurred during observational day-time. Because this exposure covered observational day- and night-time, we used only the data during observational night-time. The night-time exposure No. 15 covers a part of the decaying tail of the flare and therefore shows a higher mean countrate than quiescent counterparts.
Solar flare events covered by both the TIMED and SORCE missions.
3.4. Solar C iii(λ1176 Å)/C iii(λ977 Å) line ratio
Mass ejections are directly detectable in the Sun. Therefore the Sun is the only star in which the correlation between CMEs and flares as well as a possible response of the C iii(λ1176 Å)/C iii(λ977 Å) ratio can be studied in detail.
For this purpose we analyzed solar disk-integrated spectra obtained from the SOlar Radiation & Climate Experiment (SORCE3) and Thermosphere Ionosphere Mesosphere Energetics and Dynamics (TIMED4) missions. Both satellites have spectrographs onboard (SORCE/Solstice – McClintock et al.2005; and TIMED/SEE – Woods et al.1998) that operate in the UV range (SORCE: 1150–3200 Å, TIMED: 270–1950 Å). However, owing to the specific observational setup, only one of the spectrographs is able to cover both emission lines simultaneously. The TIMED/SEE spectrograph covers both lines but it has a mask around the Lyα(λ1216 Å) line that blocks solar radiation at these wavelengths. Therefore the C iii(λ1176 Å) line is not available in TIMED/SEE spectra. We used the Solstice spectrograph for measuring the C iii(λ1176 Å) multiplet and the SEE spectrograph for the C iii(λ977 Å) singlet. Both satellites orbit the earth about 14–15 times a day and yield the same number of daily full-disk spectra, each with an exposure time of about three minutes. Because we are interested in the influence of flares and CMEs on the carbon-ion line ratio, we searched both data archives for temporally coinciding spectra. We compared flare peak times measured by the Geostationary Operational Environmental Satellite (GOES5) with Onset2 times (quadratic fit – extrapolated to a CME height of 1 R⊙ corresponding to the solar limb) obtained by the Large Angle and Spectrometric Coronagraph (LASCO6). We found a handful of temporally overlapping spectra covering six flares of GOES class C to M. In addiation we found two GOES X-class events whose TIMED and SORCE spectra are temporally separated by up to three and a half minutes (see Table 4).
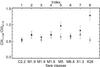 |
Fig. 6 C iii(λ1176 Å)/C iii(λ977 Å) ratio during solar flare events (indicated by asterisks) with respect to their quiescent values (indicated by triangles). Because the TIMED and SORCE spectra totally overlap in rare cases, time shifts occur. Therefore the values of the carbon ion ratio should be treated with caution. However, a possible trend of the ratio increasing during solar flaring can be seen from the plot. |
The absolute values for the line ratio shown in Fig. 6 should be interpreted with caution, because the SEE instrument is suffering from strong degradation effects in the spectral region of the C iii(λ977 Å) singlet, which can be recognized by the increasing measurement uncertainties during the mission lifetime. The spectral uncertainty increased from ~20% in 2002 up to ~40% in 2009. This results in a reduced measurement of the flux of the C iii(λ977 Å) line, and therefore increases the C iii(λ1176 Å)/C iii(λ977 Å) line ratio artificially. A comparison (priv. comm. Marty Snow) of the TIMED/SEE irradiance spectrum with an irradiance spectrum from a rocket-flight observation (prototype of the Extreme ultraviolet Variability Experiment/EVE7 instrument) showed that the SEE flux measurement of C iii(λ977 Å) is about 25% lower than the corresponding rocket irradiance spectrum (the rocket irradiance spectrum was recorded on 2008 April 4). The spectral uncertainty of the Solstice instrument covering the C iii(λ1176 Å) line is ~5%.
The spectral resolution of both instruments is 0.1 nm, which is low, but sufficient for irradiance measurements, the main reason for which the spectrographs were built. For flux measurements of single spectral lines, as in our case, a higher resolution would be desirable. The C iii(λ1176 Å) line shows no blend with other lines, but the single components of the multiplet cannot be resolved. The C iii(λ977 Å) line is blended with the Lyγ(λ972 Å) line. For this reason we fitted two Gaussians to the blended profile to reconstruct the C iii(λ977 Å) line.
It is also necessary for the computation of the solar C iii(λ1176 Å)/C iii(λ977 Å) line ratio to investigate if geocoronal emission is present at these wavelengths. For the investigation of airglow contamination we made use of the analysis by Feldman et al. (2001). These authors provide FUSE spectra of the earth’s illuminated disk. In the wavelength region in which the C iii(λ1176 Å) line occurs, the day-time airglow spectra (Feldman et al. 2001) show no enhancements. Around 976.5 Å there is a known O i airglow emission line that is also visible in the FUSE airglow spectra. We estimate the flux of this airglow feature to be negligible (below 1%) compared to the TIMED C iii(λ977 Å) flux. In addition, airglow at these wavelengths scales linearly with solar activity.
The temporal coincidence of TIMED and SORCE observations is fairly poor, but we see that highly energetic flares tend to show higher C iii(λ1176 Å)/C iii(λ977 Å) line ratios than during solar quiescence. The C iii(λ1176 Å)/C iii(λ977 Å) ratios of all powerful solar events investigated in this study show distinct enhancements. This can be seen from Fig. 6, in which we plot the results of all events from Table 4. For every single active ratio a corresponding quiescent ratio was calculated from spectra with the smallest possible temporal offset. Asterisks correspond to line ratios computed from flare spectra, whereas triangles correspond to measurements during solar quiescence. The errors were computed in the same manner as for the FUSE data, but also considering the degradation of the SEE detectors (see above). The C-class event shows nearly the same line ratio for the active and quiescent case. The M-class events show only marginal differences between flaring and quiescent cases, except for the M5 event, which clearly shows an enhanced flare line ratio. And finally, both X-class events show a distinct enhancement of the flare line ratio, especially for the X28 Halloween event. By separately analyzing the C iii(λ1176 Å) and C iii(λ977 Å) profiles, we see that if the ratio of both lines is enhanced, as in the case of the M5, X1.3, and X28 events, the reason for the enhancement is a much stronger C iii(λ1176 Å) profile, although the C iii(λ977 Å) is also stronger than during quiescence.
We found in total more than 330 spectra of the SORCE and TIMED missions whose start times differ by < 43 s. From these we computed a mean line ratio of 0.63 ± 0.11. Dupree et al. (1976) found a C iii(λ1176 Å)/C iii(λ977 Å) ratio of ~0.3 for quiet solar regions at disk center, which is about half of our mean ratio.
4. Discussion
In this section we will discuss the line asymmetries detected in the FUSE spectra of AD Leo and additional solar/stellar phenomena that could be related to these asymmetries. Furthermore, we discuss the relation of solar/stellar flare/CME events and the C iii(λ1176 Å)/C iii(λ977 Å) line ratio.
4.1. Line asymmetries in the spectra of AD Leo
Emission of moving plasma might be detectable in the wavelength wings of spectral lines as extra emissions or broadened wings. Such line asymmetries have been reported several times for main-sequence late-type stars. An analysis of a time series of Hγ spectra of AD Leo (Houdebine et al. 1990) showed a transient phenomenon in the blue wing of the Balmer line, lasting for three spectra until it vanished. This event took place at the onset of a violent flare, and was interpreted as a high-velocity (5800 km s-1) mass ejection. Fuhrmeister & Schmitt (2004) investigated a set of optical spectra of the dM9 star DENIS 104814.7-395606.1, obtained by the UVES spectrograph installed on ESO’s VLT. These authors reported on a huge flare, with blue-shifted Hα, Hβ, and NaD lines indicating mass motions. They also detected line asymmetries/enhancements in the blue wing of Hα and Hβ. This enhancement with a corresponding velocity of about 100 km s-1 was attempted to be explained by a static and dynamic scenario. The static scenario considered prominences co-rotating with the star. Because the enhancement was detected in only one spectrum, a dynamic interpretation was favored, which considered mass ejected from the star as the explanation of the observed spectral enhancement. Ake et al. (2000) analyzed a set of FUSE data of AB Dor. These authors found a O vi(λ1032 Å) flare profile with a distinct red wing asymmetry. The red wing asymmetry was interpreted as a possible “downward-flowing flare material” often seen in solar post-flare loops as sunward moving voids (McKenzie & Hudson 1999, 2001). Vilhu et al. (1998) analyzed UV spectra of AB Dor obtained by the Goddard High Resolution Spectrograph (GHRS) of the HST. The authors detected a strong flare that exceeded the quiescent level by a factor of 7. The C iv(λ1549 Å) spectral line was broadened and the blue wing was shifted by −190 km s-1. The blue shift was suspected to be caused by chromospheric evaporation processes. Bookbinder et al. (1992) analyzed multi-wavelength observations of AD Leo. During a flare detected in HST spectra, the authors found strong redshifts (+650 km s-1) in the C iv(λ1549 Å) spectral line, but no blue-shifts.
The ALE of the current study shows similarity to the above mentioned blue-wing enhancements, in particular to the event described in Fuhrmeister & Schmitt (2004). A main difference of the ALE and the above reported spectral features is that the ALE did not occur during the onset or peak of a flare. The O vi(λ1032 Å) lightcurve of the AD Leo flare shows just a weak peak (see Fig. 4) but a higher mean countrate (0.64 ct/s, averaged night time counts) than light curves of this sample recorded during quiescence (0.43 ct/s). The subsequent ALE lightcurve shows no variation, but the highest mean countrate (0.72 ct/s) of the O vi(λ1032 Å) LiF1a light curves. The temporal separation of both exposures is about two hours. Because of the high mean countrate of exposure No. 38, we expect that this exposure still belongs to the ALE and shows a part of the decaying tail of the flare.
The velocity of the ALE is nearly the same as in the report of Fuhrmeister & Schmitt (2004). The velocity of chromospheric evaporation in the solar transition region was measured to be ~−100 km s-1 (Teriaca et al. 2003). Also solar quiescent plasma motions were found to be in the velocity range of 5–100 km s-1 (Sandlin et al. 1977; Peter & Judge 1999; Teriaca et al. 1999; Hara et al. 2008), whereas solar CME velocities range from some tens of km s-1 to more than 2500 km s-1, with an average velocity of 490 km s-1 (Gopalswamy 2004). The deduced velocity of the ALE is not that exceptionally high that it can be easily attributed to a certain phenomenon, as in the case of Houdebine et al. (1990). However, the velocity that one deduces from spectra is always the component of the velocity in the observers direction. E.g., if we assume a CME propagating with a pitch angle of 269° (this is the maximum angle for the eastern stellar limb, at 270° there is no normal component of velocity), with a normal component of 100 km s-1, the real velocity would be 5730 km s-1, which is roughly the normal component for the event detected in Houdebine et al. (1990). Observations of the UVCS instrument, which observes CMEs at different heights in the 500–1300 Å wavelength range, onboard SOHO have shown that when a CME front is crossing the spectral slit, only small blueshifts are detected in the O vi lines (Ciaravella et al. 2006), whereas the CME-core shows larger Doppler shifts because of its higher density. CME fronts cannot be resolved in stellar spectra, but a CME core could produce observable signatures if massive enough.
To exclude the possibility that the ALE is a signature of a prominence co-rotating with the star, we examine the same estimation of the height of a possible prominence as in Fuhrmeister & Schmitt (2004). These authors estimated the height (R) of the possible cloud and compared it to the Keplerian radius (RCo). For a stable solution it must be valid that R ≤ RCo. Using the relation R = vP/2π, where R is the distance from the rotation axis, v is the measured radial velocity of ALE, and P is the rotation period, we computed the height of the possible prominence. Because the inclination of AD Leo is known to be about 20° (Morin et al. 2008), we used v/sini for the radial velocity, which increased the measured 100 km s-1 to 292 km s-1. This calculation was then compared to the co-rotation radius for AD Leo, which was calculated using RCo = (GM/ω2)1/3, where G is the gravitational constant, ω = 2π/P the angular velocity, and M the mass of AD Leo (0.423 M⊙). The co-rotation radius RCo is 11.68 RLeo and the distance R is 27.9 RLeo, therefore an interpretation of the ALE as a prominence signature is unlikely. Moreover, the signature is detected in only one out of fourty spectra spanning a time range of about 65 h, corresponding to one rotation period of AD Leo (2.2 d Morin et al. 2008).
According to the investigations of the ALE above, we can exclude that the feature is a signature of a plasma cloud co-rotating with AD Leo. Owing to the low deduced projected Doppler velocity of − 84 km s-1, one cannot directly assign the spectral feature to a stellar mass ejection on AD Leo. Because the ALE is detected in only one spectrum, we exclude also quiescent plasma motions, known from the Sun to be in the range of 5–100 km s-1, because they should be seen more often. Although there is a delay of ~2 h between exposure Nos. 37 and 38, exposure 38 may show the decaying tail of the flare detected in exposure No. 37. If this is the case, we could see the ALE a a signature of a stellar CME related to the flare detected in exposure No. 37. Of these considerations we favor the ALE to be a signature of a stellar mass ejection on AD Leo, with a Doppler velocity appearing low owing to projection effects.
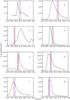 |
Fig. 7 Temporal windows of the corresponding SORCE (solid red line) and TIMED (solid blue line) spectra. Obviously all spectra were recorded during solar flaring. None of them could cover the whole flare owing to the fixed exposure time of 3 min. In only two cases (5, 8) the spectra cover also a part of the flare peak. The shown lightcurves are GOES lightcurves, observed in a wavelength range of 0.5–4 Å. |
4.2. The solar /stellar C iii(λ1176 Å)/C iii(λ977 Å) ratio
The fact that the C iii(λ1176 Å)/C iii(λ977 Å) ratio is considerably enhanced during stellar flaring is found in other investigations on active stars (Christian et al. 2006; Del Zanna et al. 2002). As discussed in Sect. 3.3, deducing the electron density from this particular ratio is questionable in active stars such as in the current study because the ratio is significantly higher in both the quiescent and active cases, compared to solar values. However, the question arises if the line ratio is also enhanced during solar flaring and if it is also enhanced through CMEs?
Dupree et al. (1976) already showed that the ratio is different for quiescent and active regions on the Sun. Because the ratio is sensitive to electron density, could a mass ejection increase this ratio? CMEs cause regions of increased electron density (Kathiravan & Ramesh 2005) in the solar atmosphere and the ratio should therefore be affected to a certain degree. This line ratio is also increased by flares on stars, as shown and cited above. We expect the same behavior for the Sun, but is the increase also detectable in full-disk-integrated spectra, which are similar to stellar observations and is it possible to distinguish between the influence of flares and CMEs?
The analysis of the TIMED and SORCE spectra shows that the C iii(λ1176 Å)/C iii(λ977 Å) ratio seems to be enhanced for more energetic flares (M-, and X-class flares). The strength of the enhancement depends on the strength of the flare (see Fig. 6). All M-class flares show a marginal difference of active and quiescent line ratios, except for the M5 class flare, which distinctively enhances the line ratio. This ratio is even higher than the X1.3 event. A main reason for this difference is the different coverage of flare parts by the SORCE and TIMED instruments (cf. Fig. 7). In Table 4 one can see that the flare peak of event No. 5 is covered by both instruments, whereas the flare peak of event No. 7 is not covered. The corresponding TIMED spectrum of event No. 5 starts 43 s earlier than the SORCE spectrum. Therefore the line ratio for event No. 5 is overestimated. The line ratio of event No. 7 is also overestimated, because the TIMED spectrum start time is more than three minutes later than the corresponding SORCE spectrum start time. The same can be stated for events Nos. 4 and 6, in which the SORCE spectra start about one minute before the TIMED spectra. In Fig. 7 we show the GOES lightcurves for a wavelength interval of 0.5–4 Å of the investigated flare events. The red and blue solid vertical lines denote start- and stop times of the corresponding SORCE and TIMED spectra. Clearly, all flares are partly covered by the spectra. In only two cases (Nos. 5, 8) both spectra cover the flare peak, these are interestingly the ones with the highest C iii line ratio. All other spectra were recorded during the flare decay phase (except No. 3). In the solar flare sample used in the current study, one C-, five M- and two X-class flares are included. Because the spectra were recorded during different phases of the flares, we also use the X-ray luminosity ranges of the flare phase during which the spectra were recorded rather than the flare X-ray classes alone. However, it seems that during solar flaring the C iii(λ1176 Å)/C iii(λ977 Å) ratio is enhanced, dependent on the strength of the flare.
Because there were only eight flare events that were covered by the TIMED and SOLSTICE instruments, the trend we see from the investigation of the solar C iii(λ1176 Å)/C iii(λ977 Å) line ratio is of low statistical significance. A considerably higher number of events would be needed. Because of the limited number of temporally coinciding TIMED and SORCE spectra it is not possible to investigate the correlation of CMEs and the carbon-ion line ratio.
5. Conclusions and outlook
On the Sun flares and CMEs are known to be correlated on a temporal and/or spatial scale, at least for the strongest CMEs (halo) and flares (X-class). On the stellar side we know very little about CMEs, not to mention the correlation of flares and CMEs. We discussed stellar CMEs a) using the density-sensitive line ratio C iii(λ1176 Å)/C iii(λ977 Å), which should be affected by density changes caused by CMEs (see Sect. 4.2) and b) searching for Doppler shifts and line asymmetries in stellar spectral lines. The C iii ratio was found to be increased in the present study during stellar flaring of AD Leo, AU Mic, and AB Dor. We tried to reproduce these findings on the Sun using full-disk spectra obtained by the TIMED and SORCE missions. Owing to a lack of coinciding TIMED and SORCE spectra (see Sect. 3.4), we were only able to investigate the response on solar flares but not on solar CMEs. Strong flares seem to cause enhanced C iii(λ1176 Å)/C iii(λ977 Å) line ratios, whereas weak ones do not.
The investigation of the variation of the solar C iii(λ1176 Å)/C iii(λ977 Å) line ratio and solar CMEs needs certainly full-disk spectra with a higher cadence. The already operating EVE instrument suite onboard NASA’s Solar Dynamics Observatory (SDO) provides full-disk spectroscopy with the Multiple EUV Grating Spectrograph (MEGS). A cadence of 20 s with a spectral resolution of 0.1 nm (the same resolution as for the TIMED/SEE instrument) is achieved. But again, only the C iii(λ977 Å) line can be measured owing to the wavelength coverage of 0.1–105 nm of the MEGS instrument. There is at the moment no follow up mission providing a higher cadence for the investigation of the C iii(λ1176 Å) line. In addition, the last years were affected by low solar activity. The next solar maximum should be around 2012/2013 when we expect powerful solar flares and CMEs again, which are a requirement for a follow-up study.
Whether the above mentioned events are caused by the flares or possibly by related CMEs may be suspected but cannot be proven in the current study by line shifts or asymmetries as indicators for mass ejections. Only the O vi(λ1032 Å) line of the AD Leo spectrum No. 38 shows a distinct blue-wing enhancement, separated by about two hours from the flare spectrum No. 37. Whether exposure No. 38 shows the decaying tail of the flare detected in exposure No. 37 cannot be clearly stated because of the two-hour difference between both exposures. As shown in Sect. 4.1, we favor a scenario of plasma ejected by the star similar to Fuhrmeister & Schmitt (2004).
The FUSE data of all three stars show in total four night-time flares, of which only one was accompanied by a spectral line asymmetry. The absence of accompanying line asymmetries might have the following reasons: a) there were no accompanying mass ejections, b) there was no detection of mass ejections in the spectra owing to projection effects, and c) the possible mass ejections were too weak to be detected in the spectra. Recent attempts to detect phenomena (radio type II bursts) related to CMEs (as known from the Sun) on the two dMe stars AD Leo and EV Lac (Leitzinger et al. 2009) turned out to be diffcult to interpret. The detection of signatures of stellar mass ejections is still a difficult task, and the interpretation of signatures, if detected, turns out to be tricky as well. However, more detections of possible signatures of stellar CME would be preferable, which would certainly help to constrain the interpretation of these signatures, because a wider range of parameters (of the signatures) would be available for comparison.
Because CMEs may be a main contributor to non-thermal mass loss processes of planetary atmospheres, a more detailed knowledge of stellar CME behavior would be of vital importance also in the context of planetary evolution and consequently, as well as habitability.
Acknowledgments
M.L., P.O. and A.H. gratefully acknowledge the Austrian Science Fund (FWF): P19446-N16, P22950-N16 for supporting this study. T.V.Z. and M.L.K. gratefully acknowledge the Austrian Science Fund (FWF):P21197-N16. This research has made use of the SIMBAD database, operated at CDS, Strasbourg, France. We thank Marty Snow, Rachel Hock, and Don Woodraska (LASP/Colorado, USA) for helping in the analysis of the TIMED/SEE and SORCE/Solstice data. We also thank Graham Harper (Trinity College/Dublin, Ireland) for helping in the analysis of the FUSE data. In addition we thank Robert Greimel (University of Graz/Austria) for many helpful comments on the manuscript and on the analysis of the TIMED/SEE data. Finally we thank the anonymous referee for many helpful comments helping to improve the manuscript.
References
- Ake, T. B., Dupree, A. K., Young, P. R., et al. 2000, ApJ, 538, L87 [NASA ADS] [CrossRef] [Google Scholar]
- Ambruster, C. W., Pettersen, B. R., Hawley, S., Coleman, L. A., & Sandmann, W. H. 1986, in New Insights in Astrophysics, Eight Years of UV Astronomy with IUE, ed. E. J. Rolfe, ESA Spec. Publ., 263, 137 [Google Scholar]
- Ayres, T. R., Brown, A., Osten, R. A., et al. 2001, ApJ, 549, 554 [NASA ADS] [CrossRef] [Google Scholar]
- Barnes, S. A. 2007, ApJ, 669, 1167 [NASA ADS] [CrossRef] [Google Scholar]
- Bloomfield, D. S., Mathioudakis, M., Christian, D. J., Keenan, F. P., & Linsky, J. L. 2002, A&A, 390, 219 [NASA ADS] [CrossRef] [EDP Sciences] [Google Scholar]
- Bond, H. E., Mullan, D. J., O’Brien, M. S., & Sion, E. M. 2001, ApJ, 560, 919 [NASA ADS] [CrossRef] [Google Scholar]
- Bookbinder, J. A., Walter, F. M., & Brown, A. 1992, in Cool Stars, Stellar Systems, and the Sun, ed. M. S. Giampapa, & J. A. Bookbinder, ASP Conf. Ser., 26, 27 [Google Scholar]
- Chen, H. D., Jiang, Y. C., Li, Q. Y., & Zhao, S. Q. 2005, in Coronal and Stellar Mass Ejections, ed. K. Dere, J. Wang, & Y. Yan, IAU Symp., 226, 209 [Google Scholar]
- Christian, D. J., Mathioudakis, M., Bloomfield, D. S., et al. 2006, A&A, 454, 889 [NASA ADS] [CrossRef] [EDP Sciences] [Google Scholar]
- Ciaravella, A., Raymond, J. C., Fineschi, S., et al. 1997, ApJ, 491, L59 [NASA ADS] [CrossRef] [Google Scholar]
- Ciaravella, A., Raymond, J. C., Kahler, S. W., Vourlidas, A., & Li, J. 2005, ApJ, 621, 1121 [NASA ADS] [CrossRef] [Google Scholar]
- Ciaravella, A., Raymond, J. C., & Kahler, S. W. 2006, ApJ, 652, 774 [NASA ADS] [CrossRef] [Google Scholar]
- Cully, S. L., Fisher, G. H., Abbott, M. J., & Siegmund, O. H. W. 1994, ApJ, 435, 449 [NASA ADS] [CrossRef] [Google Scholar]
- Del Zanna, G., Landini, M., & Mason, H. E. 2002, A&A, 385, 968 [NASA ADS] [CrossRef] [EDP Sciences] [Google Scholar]
- Dixon, W. V., Sahnow, D. J., Barrett, P. E., et al. 2007, PASP, 119, 527 [NASA ADS] [CrossRef] [Google Scholar]
- Dupree, A. K., Foukal, P. V., & Jordan, C. 1976, ApJ, 209, 621 [NASA ADS] [CrossRef] [Google Scholar]
- Dupree, A. K., Ake, T. B., Brickhouse, N. S., Hussain, G. A. J., & Jardine, M. 2006, in Astrophysics in the Far Ultraviolet: Five Years of Discovery with FUSE, ed. G. Sonneborn, H. W. Moos, & B.-G. Andersson, ASP Conf. Ser., 348, 168 [Google Scholar]
- Engle, S. G., Guinan, E. F., & Mizusawa, T. 2009, in AIP Conf. Ser. 1135, ed. M. E. van Steenberg, G. Sonneborn, H. W. Moos, & W. P. Blair, 221 [Google Scholar]
- Feldman, P. D., Sahnow, D. J., Kruk, J. W., Murphy, E. M., & Moos, H. W. 2001, J. Geophys. Res., 106, 8119 [NASA ADS] [CrossRef] [Google Scholar]
- Fuhrmeister, B., & Schmitt, J. H. M. M. 2004, A&A, 420, 1079 [NASA ADS] [CrossRef] [EDP Sciences] [Google Scholar]
- Gopalswamy, N. 2004, in The Sun and the Heliosphere as an Integrated System, ed. G. Poletto, & S. T. Suess, Astrophys. Space Sci. Lib., 317, 201 [Google Scholar]
- Grießmeier, J., Stadelmann, A., Motschmann, U., et al. 2005, Astrobiology, 5, 587 [NASA ADS] [CrossRef] [Google Scholar]
- Guinan, E. F., Ribas, I., & Harper, G. M. 2003, ApJ, 594, 561 [NASA ADS] [CrossRef] [Google Scholar]
- Hara, H., Watanabe, T., Harra, L. K., et al. 2008, ApJ, 678, L67 [NASA ADS] [CrossRef] [Google Scholar]
- Holmberg, J., Nordström, B., & Andersen, J. 2009, A&A, 501, 941 [NASA ADS] [CrossRef] [EDP Sciences] [Google Scholar]
- Houdebine, E. R., Foing, B. H., & Rodono, M. 1990, A&A, 238, 249 [NASA ADS] [Google Scholar]
- Kathiravan, C., & Ramesh, R. 2005, ApJ, 627, L77 [NASA ADS] [CrossRef] [Google Scholar]
- Katsova, M. M., Drake, J. J., & Livshits, M. A. 1999, ApJ, 510, 986 [NASA ADS] [CrossRef] [Google Scholar]
- Khodachenko, M. L., Ribas, I., Lammer, H., et al. 2007, Astrobiology, 7, 167 [NASA ADS] [CrossRef] [PubMed] [Google Scholar]
- Lammer, H., Lichtenegger, H. I. M., Kulikov, Y. N., et al. 2007, Astrobiology, 7, 185 [NASA ADS] [CrossRef] [PubMed] [Google Scholar]
- Leitzinger, M., Odert, P., Hanslmeier, A., et al. 2009, in AIP Conf. Ser. 1094, ed. E. Stempels, 680 [Google Scholar]
- McClintock, W. E., Rottman, G. J., & Woods, T. N. 2005, Sol. Phys., 230, 225 [NASA ADS] [CrossRef] [Google Scholar]
- McKenzie, D. E., & Hudson, H. S. 1999, ApJ, 519, L93 [NASA ADS] [CrossRef] [Google Scholar]
- McKenzie, D. E., & Hudson, H. S. 2001, Earth, Planets, and Space, 53, 577 [Google Scholar]
- Montes, D., López-Santiago, J., Gálvez, M. C., et al. 2001, MNRAS, 328, 45 [NASA ADS] [CrossRef] [MathSciNet] [Google Scholar]
- Moos, H. W., Cash, W. C., Cowie, L. L., et al. 2000, ApJ, 538, L1 [NASA ADS] [CrossRef] [Google Scholar]
- Morin, J., Donati, J., Petit, P., et al. 2008, MNRAS, 390, 567 [NASA ADS] [CrossRef] [MathSciNet] [Google Scholar]
- Munro, R. H., Dupree, A. K., & Withbroe, G. L. 1971, Sol. Phys., 19, 347 [NASA ADS] [CrossRef] [Google Scholar]
- Peter, H., & Judge, P. G. 1999, ApJ, 522, 1148 [NASA ADS] [CrossRef] [Google Scholar]
- Pizzolato, N., Maggio, A., Micela, G., Sciortino, S., & Ventura, P. 2003, A&A, 397, 147 [NASA ADS] [CrossRef] [EDP Sciences] [Google Scholar]
- Redfield, S., & Linsky, J. L. 2000, ApJ, 534, 825 [NASA ADS] [CrossRef] [Google Scholar]
- Redfield, S., & Linsky, J. L. 2002, ApJS, 139, 439 [NASA ADS] [CrossRef] [Google Scholar]
- Redfield, S., Ayres, T. R., Linsky, J. L., et al. 2003, ApJ, 585, 993 [NASA ADS] [CrossRef] [Google Scholar]
- Robinson, R. D., Linsky, J. L., Woodgate, B. E., & Timothy, J. G. 2001, ApJ, 554, 368 [NASA ADS] [CrossRef] [Google Scholar]
- Sandlin, G. D., Brueckner, G. E., & Tousey, R. 1977, ApJ, 214, 898 [NASA ADS] [CrossRef] [Google Scholar]
- Schmitt, J. H. M. M., & Liefke, C. 2004, A&A, 417, 651 [NASA ADS] [CrossRef] [EDP Sciences] [Google Scholar]
- Teriaca, L., Banerjee, D., & Doyle, J. G. 1999, A&A, 349, 636 [NASA ADS] [Google Scholar]
- Teriaca, L., Falchi, A., Cauzzi, G., et al. 2003, ApJ, 588, 596 [NASA ADS] [CrossRef] [Google Scholar]
- Vilhu, O., Muhli, P., Huovelin, J., et al. 1998, AJ, 115, 1610 [NASA ADS] [CrossRef] [Google Scholar]
- Wood, B. E., Redfield, S., Linsky, J. L., & Sahu, M. S. 2002, ApJ, 581, 1168 [NASA ADS] [CrossRef] [Google Scholar]
- Wood, B. E., Redfield, S., Linsky, J. L., Müller, H., & Zank, G. P. 2005, ApJS, 159, 118 [NASA ADS] [CrossRef] [Google Scholar]
- Woods, T. N., Bailey, S. M., Eparvier, F. G., et al. 1998, in SPIE Conf. Ser. 3442, ed. C. M. Korendyke, 180 [Google Scholar]
- Young, P. R., Dupree, A. K., Wood, B. E., et al. 2001, ApJ, 555, L121 [NASA ADS] [CrossRef] [Google Scholar]
All Tables
Flare energies (quiescent level is subtracted) for all stars in the three studied lines.
All Figures
|
Fig. 1 Shown are all flare events on AB Dor (upper panel: lightcurve of exposure No. 9 is shown), AD Leo (middle panels: lightcurves for exposures Nos. 37 and 52 are shown), and AU Mic (lower panel: lightcurve of exposure No. 9 is shown) in the light of the C iii(λ1176 Å) multiplet, in which the flares are most pronounced. The peak luminosities of the flares on AB Dor and AU Mic are a factor ten higher than for the AD Leo flares. The overlayed gray-shaded areas correspond to observational night-time. |
| In the text | |
|
Fig. 2 Averaged quiescent spectral profiles of the Lyβ line detected in the FUSE observations of AD Leo, AB Dor, and AU Mic. The Lyβ profile of AD Leo is asymmetric with a broader profile on the red side, whereas the AB Dor profile shows a weaker red asymmetry. AU Mic completes the sample with a Gaussian profile with a small but distinct extra emission in the blue wing. The spectra were extracted from the LiF1a channel and represent night-time observations only. |
| In the text | |
|
Fig. 3 Averaged quiescent spectral profiles of the O vi(1032 Å) line detected in the FUSE observations of AD Leo, AB Dor, and AU Mic. The O vi(1032 Å) profile of AD Leo shows a Gaussian shape, whereas the profile of AB Dor shows an asymmetric profile with a broad blue component. The spectrum of AU Mic exhibits a weak red wing asymmetry. The spectra were extracted from the LiF1a channel and represent night-time observations only. |
| In the text | |
|
Fig. 4 O vi(λ1032 Å) spectra, residuals, and lightcurves Nos. 37 and 38 of the FUSE time series of AD Leo. During spectrum No. 37 a flare happened in AD Leo (see Fig. 1), whereas the corresponding lightcurve of No. 38 shows no variation although we detect a higher mean countrate which possibly indicates that exposure No. 38 belongs to the decaying tail of the flare. Both line profiles differ from the quiescent profile of O vi(λ1032 Å). The line wings in both spectra are broader than in the quiescent case, profile No. 37 shows a red wing enhancement, whereas No. 38 shows a distinct blue wing enhancement, which is shifted by − 84 km s-1 (measured from maximum to maximum of the left-most fit to the line center of O vi(λ1032 Å)). A multi-Gaussian function was used to fit the observed profile. The red solid line represents the multi-Gaussian fit, whereas the thin black solid lines represent the single Gaussian components of the fit. The exposure time (after screening) for exposure No. 37 was 2020 s and for exposure No. 38, 1186 s. |
| In the text | |
|
Fig. 5 Variations of the C iii(λ1176 Å)/C iii(λ977 Å) line ratio of AD Leo, AB Dor and AU Mic. Flare spectra are marked by red asterisks. All three stars exhibit an enhanced line ratio during flares. The gray shaded areas correspond to the quiescent mean line ratios ± measurement uncertainty. All line ratio enhancements of the current study are correlated with stellar flares, as can be seen for AD Leo (upper panel), AB Dor (middle panel) and AU Mic (lower panel). In the middle panel we see another distinct line ratio enhancement (No. 15). During exposure No. 15 a flare occurred during observational day-time. The night-time data of exposure No. 15 are still affected by the flare, causing the increase of the line ratio. |
| In the text | |
|
Fig. 6 C iii(λ1176 Å)/C iii(λ977 Å) ratio during solar flare events (indicated by asterisks) with respect to their quiescent values (indicated by triangles). Because the TIMED and SORCE spectra totally overlap in rare cases, time shifts occur. Therefore the values of the carbon ion ratio should be treated with caution. However, a possible trend of the ratio increasing during solar flaring can be seen from the plot. |
| In the text | |
|
Fig. 7 Temporal windows of the corresponding SORCE (solid red line) and TIMED (solid blue line) spectra. Obviously all spectra were recorded during solar flaring. None of them could cover the whole flare owing to the fixed exposure time of 3 min. In only two cases (5, 8) the spectra cover also a part of the flare peak. The shown lightcurves are GOES lightcurves, observed in a wavelength range of 0.5–4 Å. |
| In the text | |
Current usage metrics show cumulative count of Article Views (full-text article views including HTML views, PDF and ePub downloads, according to the available data) and Abstracts Views on Vision4Press platform.
Data correspond to usage on the plateform after 2015. The current usage metrics is available 48-96 hours after online publication and is updated daily on week days.
Initial download of the metrics may take a while.