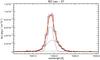
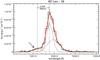
Fig. 4
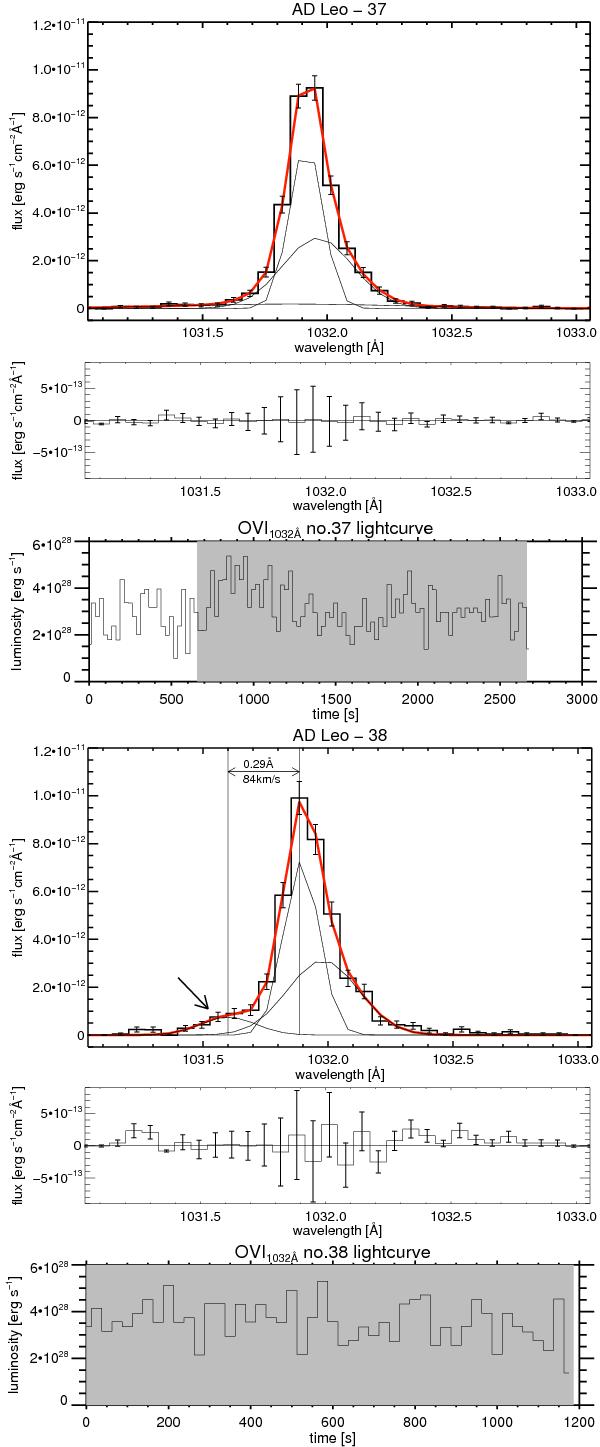
O vi(λ1032 Å) spectra, residuals, and lightcurves Nos. 37 and 38 of the FUSE time series of AD Leo. During spectrum No. 37 a flare happened in AD Leo (see Fig. 1), whereas the corresponding lightcurve of No. 38 shows no variation although we detect a higher mean countrate which possibly indicates that exposure No. 38 belongs to the decaying tail of the flare. Both line profiles differ from the quiescent profile of O vi(λ1032 Å). The line wings in both spectra are broader than in the quiescent case, profile No. 37 shows a red wing enhancement, whereas No. 38 shows a distinct blue wing enhancement, which is shifted by − 84 km s-1 (measured from maximum to maximum of the left-most fit to the line center of O vi(λ1032 Å)). A multi-Gaussian function was used to fit the observed profile. The red solid line represents the multi-Gaussian fit, whereas the thin black solid lines represent the single Gaussian components of the fit. The exposure time (after screening) for exposure No. 37 was 2020 s and for exposure No. 38, 1186 s.
Current usage metrics show cumulative count of Article Views (full-text article views including HTML views, PDF and ePub downloads, according to the available data) and Abstracts Views on Vision4Press platform.
Data correspond to usage on the plateform after 2015. The current usage metrics is available 48-96 hours after online publication and is updated daily on week days.
Initial download of the metrics may take a while.