Fig. 7
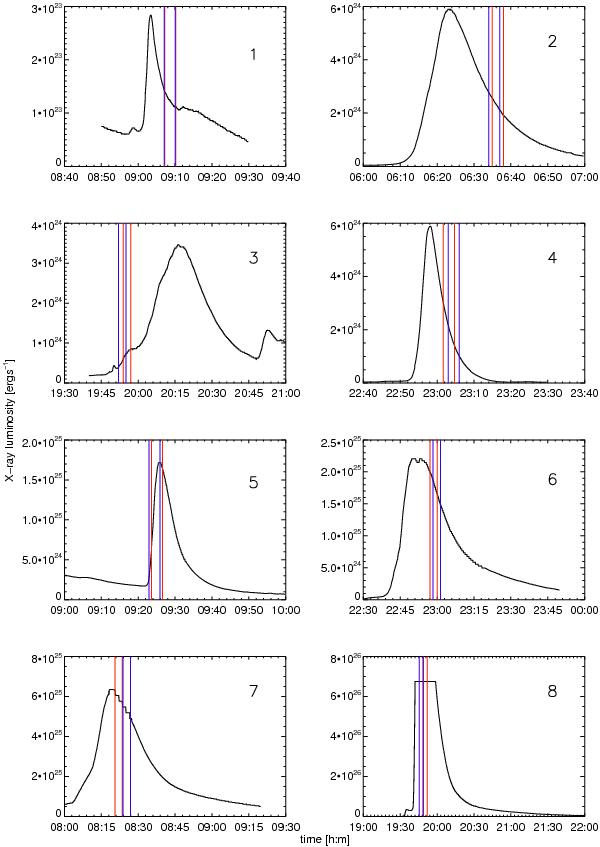
Temporal windows of the corresponding SORCE (solid red line) and TIMED (solid blue line) spectra. Obviously all spectra were recorded during solar flaring. None of them could cover the whole flare owing to the fixed exposure time of 3 min. In only two cases (5, 8) the spectra cover also a part of the flare peak. The shown lightcurves are GOES lightcurves, observed in a wavelength range of 0.5–4 Å.
Current usage metrics show cumulative count of Article Views (full-text article views including HTML views, PDF and ePub downloads, according to the available data) and Abstracts Views on Vision4Press platform.
Data correspond to usage on the plateform after 2015. The current usage metrics is available 48-96 hours after online publication and is updated daily on week days.
Initial download of the metrics may take a while.