Fig. 5
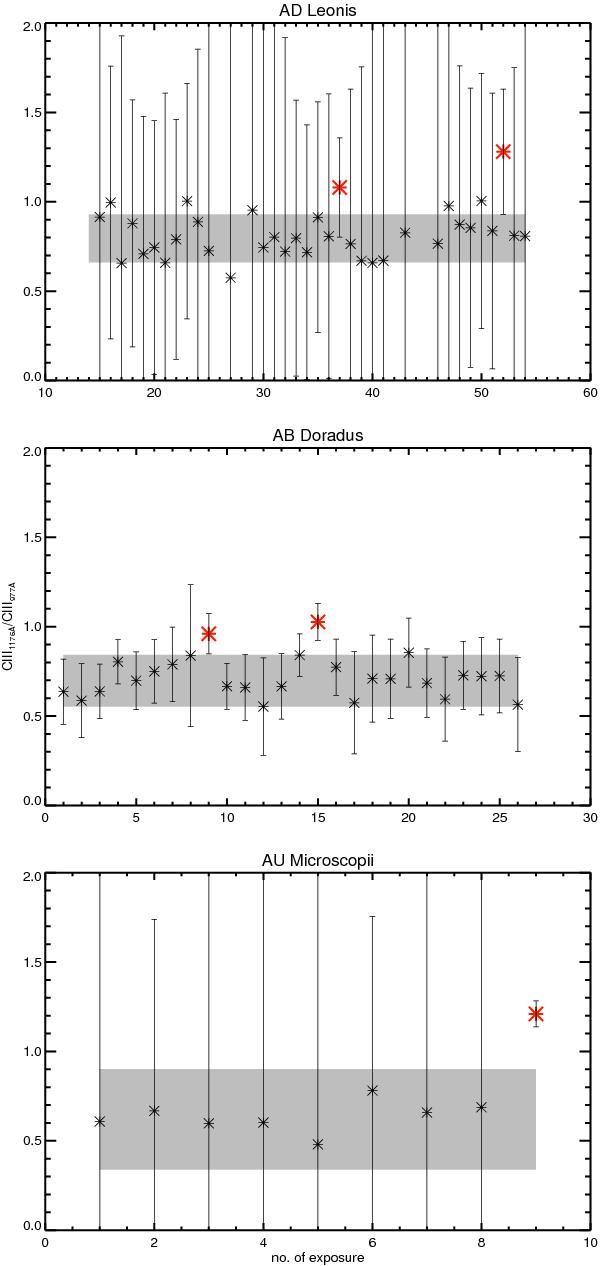
Variations of the C iii(λ1176 Å)/C iii(λ977 Å) line ratio of AD Leo, AB Dor and AU Mic. Flare spectra are marked by red asterisks. All three stars exhibit an enhanced line ratio during flares. The gray shaded areas correspond to the quiescent mean line ratios ± measurement uncertainty. All line ratio enhancements of the current study are correlated with stellar flares, as can be seen for AD Leo (upper panel), AB Dor (middle panel) and AU Mic (lower panel). In the middle panel we see another distinct line ratio enhancement (No. 15). During exposure No. 15 a flare occurred during observational day-time. The night-time data of exposure No. 15 are still affected by the flare, causing the increase of the line ratio.
Current usage metrics show cumulative count of Article Views (full-text article views including HTML views, PDF and ePub downloads, according to the available data) and Abstracts Views on Vision4Press platform.
Data correspond to usage on the plateform after 2015. The current usage metrics is available 48-96 hours after online publication and is updated daily on week days.
Initial download of the metrics may take a while.