| Issue |
A&A
Volume 534, October 2011
|
|
|---|---|---|
| Article Number | A20 | |
| Number of page(s) | 7 | |
| Section | Astronomical instrumentation | |
| DOI | https://doi.org/10.1051/0004-6361/201117660 | |
| Published online | 22 September 2011 | |
Recovering Swift-XRT energy resolution through CCD charge trap mapping
1 X-ray and Observational Astronomy Group, Department of Physics & Astronomy, University of Leicester, LE1 7RH, UK
e-mail: This email address is being protected from spambots. You need JavaScript enabled to view it.
2
ASI Science Data Center, via G. Galilei, 00044 Frascati, Italy
3
NASA/Goddard Space Flight Center, Greenbelt, MD, USA
4
Department of Astronomy & Astrophysics, 525 Davey Lab, Pennsylvania, USA
5
State University, University Park, PA 16802, USA
6 INAF-Osservatorio Astronomico di Brera, via E. Bianchi 46, 23807 Merate (LC), Italy
7
INAF-Istituto di Astrofisica Spaziale e Fisica Cosmica Sezione di Palermo, via U. La Malfa 153, 90146 Palermo, Italy
Received: 8 July 2011
Accepted: 22 August 2011
Abstract
The X-ray telescope on board the Swift satellite for gamma-ray burst astronomy has been exposed to the radiation of the space environment since launch in November 2004. Radiation causes damage to the detector, with the generation of dark current and charge trapping sites that result in the degradation of the spectral resolution and an increase of the instrumental background. The Swift team has a dedicated calibration program with the goal of recovering a significant proportion of the lost spectroscopic performance. Calibration observations of supernova remnants with strong emission lines are analysed to map the detector charge traps and to derive position-dependent corrections to the measured photon energies. We have achieved a substantial recovery in the XRT resolution by implementing these corrections in an updated version of the Swift XRT gain file and in corresponding improvements to the Swift XRT HEAsoft software. We provide illustrations of the impact of the enhanced energy resolution, and show that we have recovered most of the spectral resolution lost since launch.
Key words: X-rays: general / instrumentation: detectors / methods: numerical
© ESO, 2011
1. Introduction
The Swift satellite (Gehrels et al. 2004) was launched into a low Earth orbit on 20 November 2004 with the main objective of studying gamma-ray bursts (GRBs). The mission has been extremely successful, with the discovery of almost 100 GRBs per year and numerous milestones of GRB science, such as the first detection of an afterglow of a short GRB (Gehrels et al. 2005), the observation of the emerging shock wave of the supernova associated with GRB 060218 (Campana et al. 2006), the discovery of the extremely luminous “naked eye” GRB 080319B (Racusin et al. 2008), and the detections of very high redshift GRBs (e.g. GRB 090423 at z = 8.2, Tanvir et al. 2009, and GRB 090429B at z = 9.4, Cucchiara et al. 2011). Swift also invests an increasing fraction of its observing time (above 60% since 2008) in non-GRB science, to accommodate the Target of Opportunity requests by the scientific community and an active Guest Investigator program.
X-ray spectroscopy plays a fundamental role in the interpretation of many Swift observations. While the majority of X-ray afterglow spectra of GRBs can be fitted by an absorbed power-law, a curved model is usually preferred during bright flares (Falcone et al. 2007), and for some afterglows the spectral fit of the early decay is improved by models with additional components (Moretti et al. 2008). The accuracy of the low-energy response (below ~1 keV) is critical when measuring the absorption in GRB spectra to study their environment (Campana et al. 2010; Schady et al. 2011) and in the search for the thermal component in GRBs associated with supernovae (e.g. GRB 100316D, Starling et al. 2011). The evolution of the super-soft X-ray phase of the nova V2491 (Page et al. 2010) and the recurrent nova RS Ophiuchi 2006 (Osborne et al. 2011) was modelled from the analysis of the spectra below 1keV extracted from XRT observations. A partial covering absorber was studied in the soft Seyfert 1 WPVS 007 (Grupe et al. 2008). Furthermore, X-ray spectroscopy is key in the physical investigation of X-ray binaries (Romano et al. 2011), flaring stars (EV Lac, Osten et al. 2010) and comets (Comet 9P/Temple, Willingale et al. 2006).
The X-ray telescope (XRT; Burrows et al. 2005) on board Swift is equipped with a front-illuminated, framestore e2v CCD-22 camera with a 0.2–10 keV bandpass. Originally designed for the XMM-Newton mission, the CCD-22 utilizes an open electrode structure to improve the quantum efficiency at low energies; its imaging area consists of a 600 × 602 array of 40 × 40 μm2 pixels and a field of view of 23.6 × 23.6 arcmin. The camera houses four 55Fe calibration sources that illuminate small regions in the corners of the CCD that are not exposed to the sky. The XRT CCD can now be operated in Photon Counting (PC) mode or Windowed Timing (WT) mode. PC mode provides 2D spatial information with 2.5 s time resolution, and is typically used in observations of faint sources. The WT mode readout window consists of the central 200 columns of the detector, it provides 1D spatial information and 1.8 ms timing resolution and is best suited for bright sources.
The energy resolution of the CCD (FWHM of 135eV at 5.9keV pre-launch) has gradually degraded during the life of the mission due to the effects of radiation in space. High energy particles can displace silicon atoms in the CCD from their original position, causing defects in the lattice structure (Janesick et al. 1989). When the charge cloud generated by the absorption of an X-ray photon in silicon is transferred through the CCD image and store sections, the defects can trap a fraction of the original charge. This process is typically modelled in CCDs by the single-valued parallel and serial charge transfer inefficiency (CTI) coefficients that provide the average fractional charge loss per pixel transfer.
On the XRT, the evolution of the CTI is monitored using the reference Mn Kα line energy at 5.895 keV of the calibration corner sources. Corner source measurements also revealed that the magnitude of the damage caused by radiation is pixel-specific, with some pixels still undamaged while others had developed very deep charge trapping defects. This effect can be seen in Fig. 1, which shows the distribution of the energy trapped in individual pixels during charge packet transfers derived from the corner sources analysis. The CTI non-uniformity has previously been observed on other X-ray satellite missions as ASCA1 and Chandra (Prigozhin et al. 2000). As the standard CTI correction of Swift data is based on pixel-averaged parameterisation of the energy losses, it is only partially effective in reconstructing the intrinsic energy of the detected X-ray events. The ideal improvement in the energy corrections can only be achieved with the measurement of the charge lost to traps in each pixel of the detector.
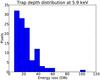 |
Fig. 1 Distribution of the energy losses in radiation-damaged pixels derived from measurements of the calibration 55Fe corner sources data. This data were taken in March 2010 and shows a large range of values of the charge lost in a pixel over the area imaged by the corner sources. A total of 18 500 pixels are illuminated by the calibration sources and were used in the analysis. The energy is reported as a 12 bit digital number (1 DN corresponds to ~ 2.75 eV), as measured by the Analog-to-Digital Converter. The analysis allows measurement of energy losses greater than 7 DN in individual pixels. |
To perform this mapping, the Swift team has a calibration program consisting of observations of the Cas A and Tycho supernova remnants, the emission-line rich spectra of which are analysed to localise traps and to measure their depths (the fractional energy loss during transfers). Calibration observations of the remnants have been repeated every six months since September of 2007; for each epoch, trap measurements were derived and included in revised versions of the CALDB gain files. New software has been developed to correct the measured photon X-ray energies for the effect of traps using the updated gain files, resulting in a significant recovery of the energy resolution in trap-corrected spectra. The updated software (task xrtcalcpi) has been included in the latest XRTDAS software package, developed under the responsibility of the ASI Science Data Center (ASDC) in Italy, and is distributed within the HEAsoft package (version 6.11) along with the new gain files and it is used by default by the Swift software version 3.8.
In Sect. 2 we highlight the main effects of radiation on the XRT CCD. In Sect. 3 we describe the technique adopted for charge trap mapping and corrections and we show the recovery in energy resolution achieved when trap corrections are applied. In Sect. 4 we summarise the charge trap calibration progress, we identify possible improvements in the current analysis, and we discuss the planned future work.
2. Radiation damage
Swift orbits the Earth at an altitude of 590 km and an inclination of 21 degrees. The XRT CCD camera on board Swift experiences a hostile space environment, in particular during the spacecraft passages through the South Atlantic Anomaly, where the camera is exposed to a very high flux of hard protons reaching low Earth orbit from the Van Allen belts. Based on a radiation study for the XRT (Short et al. 2000), the radiation dose experienced by the XRT CCD during the first 6 years of mission is estimated at a total 10 MeV equivalent proton dose of ~109 protons cm-2.
Radiation has two effects on a CCD: ionisation, with the deposited energy converted into electron-hole pairs (McLean et al. 1989); and non-ionising damage, in which the interaction causes displacements in the atomic lattice structure (Holland et al. 1993). Ionising energy losses are mostly due to high energy photons and electrons that break atomic bonds, they result in CCD voltage changes and increase in the dark current level when the generated holes are trapped close to the silicon-oxide interface (Van Lint 1987). Displacement damage, on the other hand, is due to collisions of energetic particles, mostly protons, with silicon nuclei. The collisions can generate vacancy-interstitial pairs, which increase dark current levels and generate hot pixels and charge trapping sites (Hopkinson et al. 1996).
The most evident effects of traps are the shift in overall energy scale and the concomitant degradation of the energy resolution due to charge losses during signal transfers. The shift in energy scale to lower energies is the result of the average effect of charge traps, while the degradation of the energy resolution results from the spread in the amount of charge loss from trap sites at different locations on the CCD. The spectral resolution can be partially recovered with the calibration and the correction of the trap losses, but the stochastic nature of the charge capture and release processes introduces an increase in the charge transfer noise that cannot be corrected.
In the XRT CCD the analysis of the corner source data, regularly taken to calibrate the gain and the parallel (along columns) and serial (along rows) CTI, has shown an increase in the Mn-Kα line width of 50% during the first 3 years of operations. The degradation is also evident in observations of line-rich supernova remnants, as shown in Fig. 2, which compares the Cas A spectrum in 2005 and in 2010. Because of the thermo-electric cooling power supply failure shortly after launch, the effect of radiation damage is considerably worse on the XRT than for the same EPIC MOS CCDs used on the XMM-Newton: the XMM cameras are operated at − 120 C to mitigate the effects of traps (Abbey et al. 2003), whereas the XRT CCD is operated at temperatures between − 75 to − 50 C achieved with passive cooling on Swift (Kennea et al. 2007).
In the continuum spectra of GRBs and bright active galactic nuclei, for example, the occurrence of uncorrected deep traps can introduce spectral fit residuals around the instrumental edges, in particular at the oxygen and silicon edges, where the effective area changes rapidly with energy. Charge trap losses are energy dependent, as a larger charge cloud will interact with more traps in a pixel and lose more electrons during transfers; this dependence artificially curves the observed spectra. Charge losses due to traps also affect the measured source fluxes, as seen for example in recent XRT observations of the soft neutron star RX J1856.5-3754 used to calibrate the CCD low energy response (Sect. 4.2 and Fig. 24 in Godet et al. 2009).
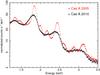 |
Fig. 2 XRT WT mode Cas A spectrum in 2005 and in 2010. The comparison shows an overall energy shift resulting from charge loss and the reduced energy resolution that causes the broadening of the brighter lines and the complete disappearance of the weaker ones. The silicon Kα line E = 1.863 keV has a FWHM of 101 ± 3 eV and of 220 ± 12eV in the 2005 and 2010 datasets respectively, as measured in IDL using a modified Gaussian function ( |


Our first approach in dealing with the spectral degradation was to broaden the original spectral response with an energy-dependent asymmetric response function. The XRT team generated and released new redistribution matrix files to match the broadened response of the detector2. There are two limiting factors in this technique. Firstly, it only models the average response of the radiation damaged CCD, without addressing the position-dependence of the charge losses; secondly, it does not attempt to recover the losses due to traps. In fact, residuals sometimes remain visible in spectral fits of bright sources of high statistical quality modelled using a broadened energy response.
The optimal approach to tackle the damage of the CCD caused by radiation is the mapping of the trap locations on the detector and the measurement of their depths. This is a novel technique, implemented here for the first time for an X-ray mission. This method allows for the correction of the trapped energy and can potentially restore the spectral resolution of the CCD to near that at launch. As the 55Fe calibration sources only cover the corners of the CCD, astrophysical sources have to be used for trap mapping purposes. Supernova remnants (SNRs) are natural candidates, as they are stable and extended X-ray sources with strong emission lines at well known energies.
The Cas A SNR, also used early in the mission for the calibration of the CCD gain, was chosen for the first attempt at trap mapping in September of 2007. More recently the Tycho SNR was preferred because of its larger size, requiring a reduced calibration time in spite of being fainter than Cas A. In addition, the silicon Kα emission line used as the reference energy varies by approximately ± 20 eV with position in the Cas A remnant (Willingale et al. 2002), while it is more uniform in Tycho (<10 eV, as derived from our analysis of XMM spectra).
3. Trap mapping
XRT observations in PC mode provide the position of the X-ray events in detector coordinates (the event coordinate DETX identifies CCD columns and DETY the rows). The higher timing resolution of WT mode observations is achieved at the expense of a limited spatial information of the detected events. Because of these differences, traps are mapped and analysed with specific techniques for the two readout modes, as described below.
3.1. Photon Counting mode
The Swift pointing accuracy ( ≤ 3′) assures that the vast majority of GRB afterglows and other X-ray targets are imaged in the central 200 × 200 pixel region of the CCD. This central window was therefore selected for an in-depth calibration of the trap losses. We performed a series of ~15 ks offset pointings of the Cas A and Tycho SNRs to uniformly cover the region, collecting an average of eight silicon line events per pixel. Gaussian fits along the CCD columns, merging events from 20 adjacent pixels, provide measurements of the Si-Kα line energy that are used to localize traps and measure their depths. An example of this analysis is shown in Fig. 3, where column 256 presents an energy offset of ~100eV at row DETY coordinate ~310. The bottom plot shows the Si-Kα line centroid energy after corrections for trap losses have been applied. This technique allows the identification of pixels affected by energy losses of 20eV or larger.
In contrast to the situation prior to launch, when analysis of the XRT door source Mn-Kα line over the entire field of view revealed only six pixels with traps deeper than 20eV, analysis of the Tycho PC calibration observations in October 2010 allowed the identification of traps in 116 pixels of the central 200 × 200 window (0.3%), of which six presented an energy offset larger than 100eV. These measurements show that a large number of traps have developed since Swift was launched into orbit.
Trap mapping requires a large investment in exposure time. To avoid exceeding the budget allocated to Swift calibration observations, traps outside the central region are investigated by measuring the cumulative energy losses in each column, from the analysis of offset pointings of the SNR illuminating the left and the right regions of the CCD. The Si-Kα line is fitted merging the events of an entire column, thus providing column energy offset values.
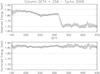 |
Fig. 3 Trap mapping and correction. In the top plot, a large energy offset is identified from the analysis of a Tycho PC mode observation in column 256 at CCD DETY coordinate ~310; in the bottom plot, the Si-Kα line energy is restored thanks to the trap corrections. |
3.2. Windowed Timing mode
In WT mode it is not possible to localize traps and measure their depth in individual pixels because the high time resolution is achieved at the expense of spatial information in the detector Y direction. We had originally hoped to use the information derived from the PC analysis for WT trap corrections. However, analysis of a subset of traps that conveniently presented both a SNR WT mode offset observation above the trap location and an offset observation below the trap location showed that the depth of a trap in WT mode could not be predicted with confidence from its depth in PC mode. We attribute this low trap depth correlation to the presence of multiple types of traps with specific charge capture and release times that result in different trap depths for the two CCD readout modes. For these reasons instead, cumulative trap losses within a CCD column sector are measured from the analysis of dedicated offset pointings of the SNRs in the top, central and bottom areas of the CCD. Energy offsets from the reference Si-Kα line are derived in the three sections for each column of the WT mode window.
We note that the xrtpipeline task, distributed as part of the XRTDAS package, reconstructs the target row detector coordinates, and the arrival times of the source X-ray events, using the input Right Ascension and Declination of the target. The estimated row position is then used by the software to apply the appropriate trap charge correction. It is therefore recommended that the targets RA and Dec derived from XRT position measurements be specified when processing WT mode data to obtain the best possible energy (and timing) resolution.
3.3. Trap depth energy dependence
Trap charge losses are dependent on the incident photon energy, as the more energetic photons generate a larger charge cloud when absorbed by the detector, and will interact with a higher number of traps in a pixel, losing more charge during the readout process. We modelled this energy dependence with a broken power law, that previous X-ray missions and laboratory experiments (Prigozhin et al. 2004) showed to provide a satisfactory fit to the energy losses, with the break at the reference energy Ebreak of 1.856keV, 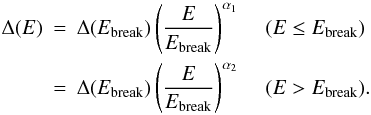 The sulphur and iron Kα lines in Cas A (ES = 2.456 keV, EFe = 6.626 keV) and Tycho (ES = 2.450 keV, EFe = 6.430 keV, derived from our fits to XMM spectra) are used to derive the energy dependence above the break, whereas the oxygen (0.570 keV and 0.654 keV) and neon (0.910 keV and 1.022 keV) emission lines of SNR E0102-72.3 (Plucinsky et al. 2008) are used below Ebreak. As all these lines are weaker compared to silicon and their profiles are broadened due to the loss in resolution caused by radiation, a degree of uncertainty in the modelling of the energy dependence is present, and can be quantified as an error in the derived broken power law indices of ± 0.05. From the fits of the lines in XSPEC, α1 = 0.75 and α2 = 0.80 were derived for PC mode observations, and α1 = 0.65 and α2 = 0.65 for WT mode.
3.4. Enhanced energy resolution
Trap mapping calibration observations are currently scheduled every six months. The end product of the analysis are tables consisting of trap positions and depths for each calibration epoch. A new format of the XRT CALDB gain file has been implemented to include the trap information and the energy dependence of the charge losses3.
The position-dependent trap energy corrections are performed by the ftool xrtcalcpi, which uses the new CALDB gain file, included in the latest XRTDAS software release (version 2.7.0). An iterative approach has been implemented in xrtcalcpi to derive the energy correction; the first iteration estimates the intrinsic event energy, which is used to quantify the trap charge losses. This iterative process is repeated twice and it assures that the correction is evaluated based on the intrinsic rather than the measured photon energy, as is required by the energy dependence of the charge losses.
A substantial recovery in resolution is achieved through trap corrections. The improvement can be seen, for example, comparing the observed and the trap-corrected WT spectra of Cas A taken in October 2007, as shown in the top panel of Fig. 4. The Si-Kα line in the corrected spectrum is narrower and has a higher peak, and the weaker lines are enhanced thanks to the correctly described charge loss. The bottom panel of Fig. 4 illustrates the results of trap mapping and corrections of Tycho observations taken in PC mode in October 2009. The recovered spectral resolution also declines, as more pixels are affected by the presence of traps and larger charge losses occur during the readout process, trap corrections are only partially successful in recovering the intrinsic spectrum. Table 1 compares the FWHM of observed and corrected spectral lines in observations of Cas A and Tycho utilized for trap mapping at different epochs.
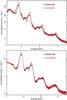 |
Fig. 4 Recovery of spectral energy resolution. (Top panel) Comparison of the observed and the trap corrected spectra extracted from WT observations of the Cas A SNR in October 2007. The fit of the Si-Kα line with an asymmetric Gaussian in IDL and a linear component to model the local continuum yielded FWHM = 159 ± 13 eV for the observed 2007 spectrum and 106 ± 3 eV for the corrected 2007 spectrum. For comparison, the FWHM value during an observation in February 2005 (shortly after launch) was 101 ± 3 eV. (Bottom panel) Results of trap mapping and corrections from PC mode observations of the Tycho SNR taken in October 2009. As radiation continues to damage the CCD the spectral resolution worsens, with a FWHM = 132 ± 3 eV after trap corrections in this case. |
Some limitations are still present in the trap mapping analysis. The accuracy of the trap measurements in PC mode data is dependent on the statistics of the reference emission line, and only pixels presenting energy offset greater than 20 eV can be identified, while shallower traps are treated as part of the overall CTI coefficients. In WT mode observations, cumulative energy offsets in three sections of each column are applied to correct the measured energies, while charge losses of individual pixels cannot be measured and corrected for. In both modes, measurements of the trap losses for bright sources could be influenced by the “sacrificial charge” effect, where traps can be filled during a CCD frame readout by the passage of a preceding charge packet, so appearing shallower to subsequent X-ray events. Additionally, the analysis of the corner source data has hinted at a possible CCD temperature dependence of the charge losses, with the likely cause being the filling of traps by thermal dark current. The temperature dependence and the “sacrificial charge” effect are yet not modelled.
Short on-axis observations of the Cas A SNR taken months apart from the trap mapping calibration epochs can be used to estimate the accuracy of the XRT energy scale of corrected spectra. The accuracy can be limited due to the as yet unmodelled effect of temperature on the traps and when a source is observed outside the central area of the CCD. In a fit of the trap-corrected spectrum of the remnant with a model derived from XMM-Newton observations, differences in energy of the EFe line of the order of 20 eV from the XMM values are measured in the PC spectrum, while in WT mode the differences can be higher, up to 30 eV. The short Cas A datasets also demonstrate the validity of trap corrections for observations not used in trap mapping calibrations. As an example, Fig. 5 shows the recovery in energy resolution for a 5.5 ks PC mode observation of Cas A taken in August 2010, corrected with trap measurements derived using Tycho calibrations of March 2010. The FWHM at 1.863 keV improves from 167 ± 10 eV to 135 ± 7 eV after trap corrections are applied, consistent with the results on Table 1.
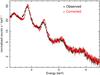 |
Fig. 5 Trap correction application. The 5.5 ks observation of the Cas A SNR taken in August 2010 in PC mode demonstrates the validity of trap corrections when applied on datasets other than those used to define the trap mapping calibrations. The Si-Kα line has FWHM of 167 ± 10 eV in the observed spectrum and of 135 ± 7 eV after trap corrections derived from Tycho calibration observations from March 2010 are applied. |
Recovered XRT spectral resolution.
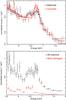 |
Fig. 6 Charge traps effect in the spectrum of EV Lac. (Top panel) The April 2008 WT observed spectrum (in black) of the flare star EV Lac after the source has faded to a count rate below 150 cts s-1 is compared to the trap-corrected spectrum (in red). The corrections enhance the main spectral peak at 6.7 keV, but no improvement is seen in the definition of the proposed emission feature at 6.4 keV. (Bottom panel) Using the previous, non trap-corrected gain file, the WT observed spectrum of EV Lac during the late decay of the flare (in black) is compared to the spectrum extracted from the columns most affected by radiation damage (in red). Charge traps cause a shift of the X-ray events to lower energies, that in the most damaged columns results in a bump at energies between 6.3 keV and 6.6 keV. |
3.5. Trap correction applications
GRB 090618 was a very bright burst at a redshift of 0.54, with an associated supernova identified from optical photometry. Page et al. (2011) processed the GRB dataset using the newly developed trap-corrected gain file, and reported the detection of a thermal component during the early X-ray afterglow decay in addition to the non-thermal synchrotron emission. Our re-analysis of this dataset using the older, non-trap corrected calibration files showed that power law indices were not significantly steeper, while the blackbody temperature was significantly lower (e.g.,  , compared to
  at 205–245 s after the BAT trigger) than when analysed using the new trap-corrected files.
A second interesting case is the dataset of the flare star EV Lac that triggered Swift in 2008. Osten et al. (2010) modelled the WT mode spectrum with a two-temperature APEC model (Smith et al. 2001) and reported the additional detection of a fluorescent iron line at 6.4 keV during the initial flare decay. An enhancement of the visibility of the emission lines is expected when trap corrections are applied, as in the case of the lines in the Cas A and Tycho SNRs. While the 6.4 keV emission feature is clearly present in the EV Lac spectra extracted using the then-correct version 10 of the CALDB gain file, the line becomes less significant when processing the data with the new, trap-corrected gain file. A comparison of the spectra, after the source has faded to a count rate below 150 cts s-1 and pile-up becomes negligible, is shown in the top panel of Fig. 6; the main Fe line at 6.7 keV in the APEC model is better defined in the trap-corrected spectrum, while no recovery of the proposed fluorescence line is achieved.
To investigate this result we exploited the information derived from the trap analysis in WT mode to identify which detector columns are most affected by radiation damage i.e., the columns that present the largest offsets in the measured event energy. We then extracted observed source spectra from the most damaged columns separately from the remainder of the CCD columns. The spectral comparison shown in the bottom panel of Fig. 6, using the older non trap-corrected gain, suggests that the feature at 6.4 keV is partly due to the energy offsets introduced by these badly damaged columns. A reassessment of the detection significance and variability of the fluorescent Fe line from EV Lac using the new calibration presented here would seem to be appropriate.
4. Conclusions and future work
The Swift XRT CCD has been exposed to the high energy particle radiation environment of space since its launch in November 2004. The passage of protons and other energetic particles through the detector has caused the displacement of silicon atoms from their lattice position, generating charge trapping sites that degrade the energy resolution. In this work we presented the trap mapping calibration initiative, consisting of the measurement of the trap positions and their depths and the application of these to correct the energy and the spectral response. We showed how the measurement of the charge losses provides a significant improvement (10–44%) in the spectral resolution and we provided examples of specific observations for which trap corrections play a significant role in the analysis of the source spectrum.
Trap calibration measurements are embodied in revised versions of the gain files. Corrections to the measured event energies are applied by default when processing the data with the xrtpipeline by a new and enhanced version of xrtcalcpi. Trap mapping observations are scheduled by the Swift team every six months to guarantee the best possible spectral resolution of the XRT. For each epoch PC and WT gain files with the latest trap measurements will be included in the CALDB update release.
Open issues remain to be addressed, including improvements in the energy, Ebreak, and in the value α1 of the energy dependence of the trap depth, the reduction of the effective trap depth caused by the partial filling of the traps by thermal electrons at warm temperatures, and the “sacrificial charge” effect in case of bright sources. To tackle these, a laboratory program was recently started at the University of Leicester, using an e2v CCD-22 exposed to 10 MeV protons at the AEA Technologies Tandem Accelerator facility with a dose approximately equivalent to two years of Swift operations in space. The test facility permits the
collection of high statistics datasets illuminating the CCD at various energies while controlling the CCD temperature settings that will allow a more precise derivation of the energy dependence of the trap depth and the evaluation of the trap filling effect by thermal electrons at warm temperatures.
“SIS Calibration and Software: Recent Developments”, http://heasarc.nasa.gov/docs/asca/newsletters/sis_calibration4.html
For a detailed description of the new gain format see http://heasarc.gsfc.nasa.gov/docs/heasarc/caldb/swift/docs/xrt/SWIFT-XRT-CALDB-04_v10.pdf
Acknowledgments
We thank the Swift science planners, Jonathan Gelbord, Craig Swenson, Michael Stroh, and Chris Wolf, for their efforts in scheduling the long and complex trap mapping calibration observations. C.P., A.P.B., A.F.A., C.M., J.P.O., P.A.E., K.L.P., gratefully acknowledge the support of the UK Space Agency. This work is supported at INAF by funding from ASI through grant I/R/011/07/0. D.N.B. and J.A.K. acknowledge support by NASA contract NAS5-00136. This work made use of the data supplied by the UK Swift Science Data Centre at the University of Leicester. This research has made use of the XRT Data Analysis Software (XRTDAS) developed under the responsibility of the ASI Science Data Center (ASDC), Italy.
References
- Abbey, A. F., Bennie, P. J., Turner, M. J. L., et al. 2003, Cooling out the radiation damage on the XMM-Newton EPIC MOS CCDs, NIM A513, 136 [Google Scholar]
- Burrows, D. N., Hill, J. E., Nousek, J. A., et al. 2005, Space Sci. Rev., 120, 165 [NASA ADS] [CrossRef] [Google Scholar]
- Campana, S., Mangano, V., Blustin, A. J., et al. 2006, Nature, 442, 1008 [NASA ADS] [CrossRef] [PubMed] [Google Scholar]
- Campana, S., Thöne, C. C., de Ugarte Postigo, A., et al. 2010, MNRAS, 402, 2429 [NASA ADS] [CrossRef] [Google Scholar]
- Cucchiara, A., Levan, A. J., Fox, D. B., et al. 2011, ApJ, 736, 7 [NASA ADS] [CrossRef] [Google Scholar]
- Falcone, A. D., Morris, D., Racusin, J., et al. 2007, ApJ, 671, 1921 [NASA ADS] [CrossRef] [Google Scholar]
- Gehrels, N., Chincarini, G., Giommi, P., et al. 2004, ApJ, 611, 1005 [NASA ADS] [CrossRef] [Google Scholar]
- Gehrels, N., Sarazin, C. L., O’Brien, P. T., et al. 2005, Nature, 437, 851 [NASA ADS] [CrossRef] [PubMed] [Google Scholar]
- Godet, O., Beardmore, A. P., Abbey, A. F., et al. 2009, A&A, 494, 775 [NASA ADS] [CrossRef] [EDP Sciences] [Google Scholar]
- Grupe, D., Leighly, K. M., & Komossa, S. 2008, AJ, 136, 2343 [NASA ADS] [CrossRef] [Google Scholar]
- Holland, A. 1993, The Effect of Bulk Traps in Proton Irradiated EEV CCDs, NIM A326, 335 [Google Scholar]
- Hopkinson, G. R. 1996, Proton Effects in Charge-Coupled Devices, IEEE Trans. Nucl. Sci., 43, 614 [Google Scholar]
- Janesick, J., Elliott, T., & Pool, F. 1989, Radiation Damage in Scientific Charge-Coupled Devices, IEEE Trans. Nucl. Sci., 36, 572 [NASA ADS] [CrossRef] [Google Scholar]
- Kennea, J. A., Burrows, D. N., Pagani, C., et al. 2007, Proc. SPIE, 6686 [Google Scholar]
- McLean, F. B., Boesch, H. E., & Oldham, T. R. 1989, Charge generation, transport and trapping, Ionizing Radiation Effects in MOS Devices and Circuits, ed. T. P. Ma, & P. Dressendorfer (John Wiley and Sons), Chap. 3 [Google Scholar]
- Moretti, A., Margutti, R., Pasotti, F., et al. 2008, A&A, 478, 409 [NASA ADS] [CrossRef] [EDP Sciences] [Google Scholar]
- Osborne, J. P., Page, K. L., Beardmore, A. P., et al. 2011, ApJ, 727, 124 [NASA ADS] [CrossRef] [Google Scholar]
- Osten, R. A., Godet, O., Drake, S., et al. 2010, ApJ, 721, 785 [NASA ADS] [CrossRef] [Google Scholar]
- Page, K. L., Osborne, J. P., Evans, P. A., et al. 2010, MNRAS, 401, 121 [NASA ADS] [CrossRef] [Google Scholar]
- Page, K. L., Starling, R. L. C., Fitzpatrick, G., et al. 2011, MNRAS, accepted [Google Scholar]
- Plucinsky, P. P., Haberl, F., Dewey, D., et al. 2008, Proc. SPIE, 7011 [Google Scholar]
- Prigozhin, G. Y., Kissel, S. E., Bautz, M. W., et al. 2000, Proc. SPIE, 4140, 123 [NASA ADS] [CrossRef] [Google Scholar]
- Prigozhin, G. Y., Bautz, M. W., Kissel, S. E., et al. 2004, Proc. SPIE, 5501, 357 [NASA ADS] [CrossRef] [Google Scholar]
- Racusin, J., Karpov, S. V., Sokolowski, M., et al. 2008, Nature, 455, 183 [Google Scholar]
- Romano, P., La Parola, V., Vercellone, S., et al. 2011, MNRAS, 410, 1825 [NASA ADS] [Google Scholar]
- Schady, P., Savaglio, S., Krühler, T., et al. 2011, A&A, 525, 113 [Google Scholar]
- Short, A. D. 2000, Swift XRT: proton enviroment and CCD degradation, Swift project document: SWIFT-LUX-RE-001/1 [Google Scholar]
- Smith, R. K., Brickhouse, N. S., Liedahl, D. A., et al. 2001, ApJ, 556, L91 [NASA ADS] [CrossRef] [Google Scholar]
- Starling, R. L. C., Wiersema, K., Levan, A. J., et al. 2011, MNRAS, 396, 935 [Google Scholar]
- Tanvir, N. R., Fox, D. B., Levan, A. J., et al. 2009, Nature, 461, 1254 [NASA ADS] [CrossRef] [PubMed] [Google Scholar]
- Van Lindt, V. A. J. 1987, The Physics of Radiation Damage in Particle Detectors, NIM A253, 453 [Google Scholar]
- Willingale, R., Bleeker, J. A. M., van der Heyden, K. J., et al. 2002, A&A, 381, 1039 [NASA ADS] [CrossRef] [EDP Sciences] [Google Scholar]
- Willingale, R., O’Brien, P. T., Cowley, S. W. H., et al. 2006, ApJ, 649, 541 [NASA ADS] [CrossRef] [Google Scholar]
All Tables
All Figures
|
Fig. 1 Distribution of the energy losses in radiation-damaged pixels derived from measurements of the calibration 55Fe corner sources data. This data were taken in March 2010 and shows a large range of values of the charge lost in a pixel over the area imaged by the corner sources. A total of 18 500 pixels are illuminated by the calibration sources and were used in the analysis. The energy is reported as a 12 bit digital number (1 DN corresponds to ~ 2.75 eV), as measured by the Analog-to-Digital Converter. The analysis allows measurement of energy losses greater than 7 DN in individual pixels. |
| In the text | |
|
Fig. 2 XRT WT mode Cas A spectrum in 2005 and in 2010. The comparison shows an overall energy shift resulting from charge loss and the reduced energy resolution that causes the broadening of the brighter lines and the complete disappearance of the weaker ones. The silicon Kα line E = 1.863 keV has a FWHM of 101 ± 3 eV and of 220 ± 12eV in the 2005 and 2010 datasets respectively, as measured in IDL using a modified Gaussian function ( |
| In the text | |
|
Fig. 3 Trap mapping and correction. In the top plot, a large energy offset is identified from the analysis of a Tycho PC mode observation in column 256 at CCD DETY coordinate ~310; in the bottom plot, the Si-Kα line energy is restored thanks to the trap corrections. |
| In the text | |
|
Fig. 4 Recovery of spectral energy resolution. (Top panel) Comparison of the observed and the trap corrected spectra extracted from WT observations of the Cas A SNR in October 2007. The fit of the Si-Kα line with an asymmetric Gaussian in IDL and a linear component to model the local continuum yielded FWHM = 159 ± 13 eV for the observed 2007 spectrum and 106 ± 3 eV for the corrected 2007 spectrum. For comparison, the FWHM value during an observation in February 2005 (shortly after launch) was 101 ± 3 eV. (Bottom panel) Results of trap mapping and corrections from PC mode observations of the Tycho SNR taken in October 2009. As radiation continues to damage the CCD the spectral resolution worsens, with a FWHM = 132 ± 3 eV after trap corrections in this case. |
| In the text | |
|
Fig. 5 Trap correction application. The 5.5 ks observation of the Cas A SNR taken in August 2010 in PC mode demonstrates the validity of trap corrections when applied on datasets other than those used to define the trap mapping calibrations. The Si-Kα line has FWHM of 167 ± 10 eV in the observed spectrum and of 135 ± 7 eV after trap corrections derived from Tycho calibration observations from March 2010 are applied. |
| In the text | |
|
Fig. 6 Charge traps effect in the spectrum of EV Lac. (Top panel) The April 2008 WT observed spectrum (in black) of the flare star EV Lac after the source has faded to a count rate below 150 cts s-1 is compared to the trap-corrected spectrum (in red). The corrections enhance the main spectral peak at 6.7 keV, but no improvement is seen in the definition of the proposed emission feature at 6.4 keV. (Bottom panel) Using the previous, non trap-corrected gain file, the WT observed spectrum of EV Lac during the late decay of the flare (in black) is compared to the spectrum extracted from the columns most affected by radiation damage (in red). Charge traps cause a shift of the X-ray events to lower energies, that in the most damaged columns results in a bump at energies between 6.3 keV and 6.6 keV. |
| In the text | |
Current usage metrics show cumulative count of Article Views (full-text article views including HTML views, PDF and ePub downloads, according to the available data) and Abstracts Views on Vision4Press platform.
Data correspond to usage on the plateform after 2015. The current usage metrics is available 48-96 hours after online publication and is updated daily on week days.
Initial download of the metrics may take a while.