Fig. 2
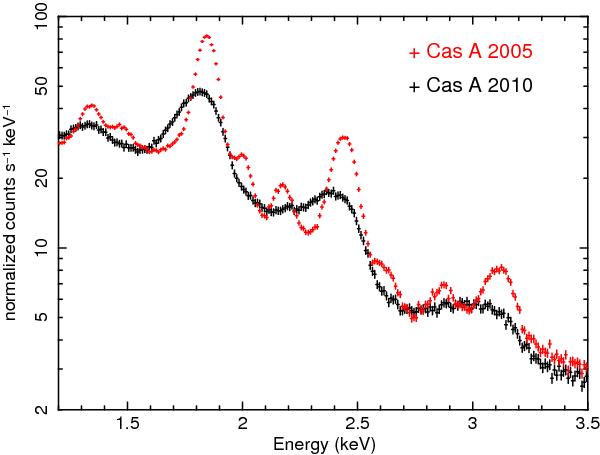
XRT WT mode Cas A spectrum in 2005 and in 2010. The comparison shows an overall energy shift resulting from charge loss and the reduced energy resolution that causes the broadening of the brighter lines and the complete disappearance of the weaker ones. The silicon Kα line E = 1.863 keV has a FWHM of 101 ± 3 eV and of 220 ± 12eV in the 2005 and 2010 datasets respectively, as measured in IDL using a modified Gaussian function ( for x ≥ E,
  for x < E) to model the asymmetric distortion of the spectral lines caused by trap losses and a linear component to model the local continuum.
Current usage metrics show cumulative count of Article Views (full-text article views including HTML views, PDF and ePub downloads, according to the available data) and Abstracts Views on Vision4Press platform.
Data correspond to usage on the plateform after 2015. The current usage metrics is available 48-96 hours after online publication and is updated daily on week days.
Initial download of the metrics may take a while.