Fig. 5
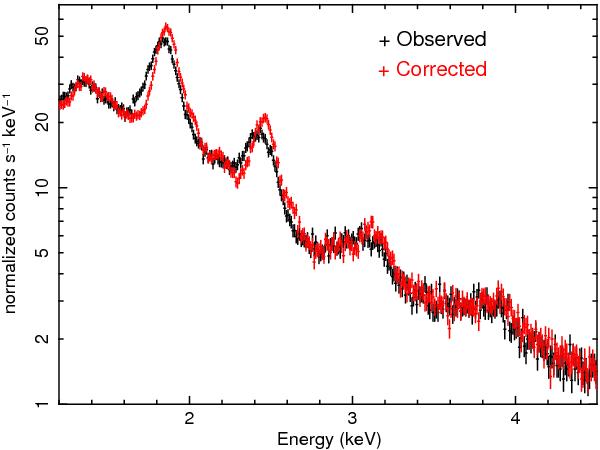
Trap correction application. The 5.5 ks observation of the Cas A SNR taken in August 2010 in PC mode demonstrates the validity of trap corrections when applied on datasets other than those used to define the trap mapping calibrations. The Si-Kα line has FWHM of 167 ± 10 eV in the observed spectrum and of 135 ± 7 eV after trap corrections derived from Tycho calibration observations from March 2010 are applied.
Current usage metrics show cumulative count of Article Views (full-text article views including HTML views, PDF and ePub downloads, according to the available data) and Abstracts Views on Vision4Press platform.
Data correspond to usage on the plateform after 2015. The current usage metrics is available 48-96 hours after online publication and is updated daily on week days.
Initial download of the metrics may take a while.