Free Access
Fig. 3
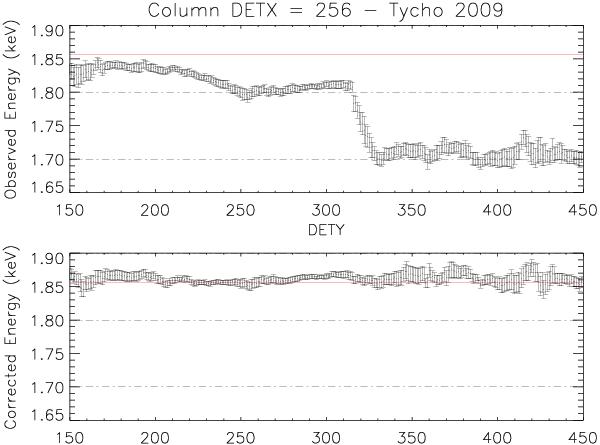
Trap mapping and correction. In the top plot, a large energy offset is identified from the analysis of a Tycho PC mode observation in column 256 at CCD DETY coordinate ~310; in the bottom plot, the Si-Kα line energy is restored thanks to the trap corrections.
Current usage metrics show cumulative count of Article Views (full-text article views including HTML views, PDF and ePub downloads, according to the available data) and Abstracts Views on Vision4Press platform.
Data correspond to usage on the plateform after 2015. The current usage metrics is available 48-96 hours after online publication and is updated daily on week days.
Initial download of the metrics may take a while.