| Issue |
A&A
Volume 533, September 2011
|
|
|---|---|---|
| Article Number | A110 | |
| Number of page(s) | 9 | |
| Section | Extragalactic astronomy | |
| DOI | https://doi.org/10.1051/0004-6361/201016170 | |
| Published online | 09 September 2011 | |
Simultaneous multi-wavelength campaign on PKS 2005-489 in a high state
1
Universität Hamburg, Institut für
Experimentalphysik, Luruper Chaussee
149, 22761
Hamburg,
Germany
2
Laboratoire de Physique Théorique et Astroparticules, Université
Montpellier 2, CNRS/IN2P3, CC 70,
Place Eugène Bataillon, 34095
Montpellier Cedex 5,
France
3
Max-Planck-Institut für Kernphysik, PO Box 103980, 69029
Heidelberg,
Germany
4
Dublin Institute for Advanced Studies,
31 Fitzwilliam Place,
Dublin 2,
Ireland
5
National Academy of Sciences of the Republic of
Armenia, Yerevan,
Armenia
6
Yerevan Physics Institute, 2 Alikhanian Brothers St., 375036
Yerevan,
Armenia
7
Universität Erlangen-Nürnberg, Physikalisches
Institut, Erwin-Rommel-Str.
1, 91058
Erlangen,
Germany
8
Nicolaus Copernicus Astronomical Center,
ul. Bartycka 18, 00-716
Warsaw,
Poland
9
CEA Saclay, DSM/IRFU, 91191
Gif-Sur-Yvette Cedex,
France
10
University of Durham, Department of Physics,
South Road, Durham
DH1 3LE,
UK
11
Centre d’Étude Spatiale des Rayonnements, CNRS/UPS,
9 Av. du Colonel Roche,
BP 4346, 31029
Toulouse Cedex 4,
France
12
Astroparticule et Cosmologie (APC), CNRS, Université Paris 7 Denis
Diderot, 10, rue Alice Domon et
Léonie Duquet, 75205
Paris Cedex 13 (UMR
7164: CNRS, Université Paris VII, CEA, Observatoire de Paris),
France
13
Laboratoire Leprince-Ringuet, École Polytechnique,
CNRS/IN2P3, 91128 Palaiseau,
France
e-mail: This email address is being protected from spambots. You need JavaScript enabled to view it.
14
Institut für Theoretische Physik, Lehrstuhl IV: Weltraum und
Astrophysik, Ruhr-Universität Bochum, 44780
Bochum,
Germany
15
Landessternwarte, Universität Heidelberg,
Königstuhl, 69117
Heidelberg,
Germany
e-mail: This email address is being protected from spambots. You need JavaScript enabled to view it.
16
Institut für Physik, Humboldt-Universität zu Berlin,
Newtonstr. 15, 12489
Berlin,
Germany
17
LUTH, Observatoire de Paris, CNRS, Université Paris
Diderot, 5 Place Jules
Janssen, 92190
Meudon,
France
18
LPNHE, Université Pierre et Marie Curie Paris 6, Université Denis
Diderot Paris 7, CNRS/IN2P3, 4
Place Jussieu, 75252, Paris Cedex
5, France
19
Institut für Astronomie und Astrophysik, Universität
Tübingen, Sand 1,
72076
Tübingen,
Germany
20
Astronomical Observatory, The University of Warsaw,
Al. Ujazdowskie 4, 00-478
Warsaw,
Poland
21
Unit for Space Physics, North-West University,
Potchefstroom
2520, South
Africa
22
Laboratoire d’Annecy-le-Vieux de Physique des Particules,
Université de Savoie, CNRS/IN2P3, 74941
Annecy-le-Vieux,
France
23
Oskar Klein Centre, Department of Physics, Stockholm University,
Albanova University Center, 10691
Stockholm,
Sweden
24
University of Namibia, Department of Physics,
Private Bag
13301, Windhoek, Namibia
25
Laboratoire d’Astrophysique de Grenoble, INSU/CNRS, Université
Joseph Fourier, BP
53, 38041
Grenoble Cedex 9,
France
26
Instytut Fizyki Ja¸drowej PAN, ul. Radzikowskiego 152, 31-342
Kraków,
Poland
27
Institut für Astro- und Teilchenphysik,
Leopold-Franzens-Universität Innsbruck, 6020
Innsbruck,
Austria
28
Department of Physics and Astronomy, The University of Leicester,
University Road, Leicester, LE1
7RH, UK
29
Obserwatorium Astronomiczne, Uniwersytet
Jagielloński, ul. Orla
171, 30-244
Kraków,
Poland
30
Toruń Centre for Astronomy, Nicolaus Copernicus
University, ul. Gagarina
11, 87-100
Toruń,
Poland
31
School of Chemistry & Physics, University of
Adelaide, Adelaide
5005,
Australia
32
Charles University, Faculty of Mathematics and Physics, Institute
of Particle and Nuclear Physics, V
Holešovičkách 2, 180
00
Prague 8, Czech
Republic
33
European Associated Laboratory for Gamma-Ray Astronomy, jointly
supported by CNRS and MPG, France
34
Oskar Klein Centre, Department of Physics, Royal Institute of
Technology (KTH), Albanova, 10691
Stockholm,
Sweden
35
School of Physics & Astronomy, University of
Leeds, Leeds
LS2 9JT,
UK
36
National Research Council Research Associate, National Academy of
Sciences, Washington, DC 20001, resident at Naval Research Laboratory,
Washington, DC
20375,
USA
37
W. W. Hansen Experimental Physics Laboratory, Kavli Institute for
Particle Astrophysics and Cosmology, Department of Physics and SLAC National
Accelerator Laboratory, Stanford University, Stanford, CA
94305,
USA
38
Istituto Nazionale di Fisica Nucleare, Sezione di
Pisa, 56127
Pisa,
Italy
39
Istituto Nazionale di Fisica Nucleare, Sezione di
Trieste, 34127
Trieste,
Italy
40
Dipartimento di Fisica, Università di Trieste,
34127
Trieste,
Italy
41
Istituto Nazionale di Fisica Nucleare, Sezione di
Padova, 35131
Padova,
Italy
42
Dipartimento di Fisica “G. Galilei”, Università di
Padova, 35131
Padova,
Italy
43
Istituto Nazionale di Fisica Nucleare, Sezione di
Perugia, 06123
Perugia,
Italy
44
Dipartimento di Fisica, Università degli Studi di
Perugia, 06123
Perugia,
Italy
45
Dipartimento di Fisica “M. Merlin” dell’Università e del
Politecnico di Bari, 70126
Bari,
Italy
46
Istituto Nazionale di Fisica Nucleare,
Sezione di Bari, 70126
Bari,
Italy
47
Institut de Ciencies de l’Espai (IEEC-CSIC),
Campus UAB, 08193
Barcelona,
Spain
48
NASA Goddard Space Flight Center, Greenbelt, MD
20771,
USA
e-mail: This email address is being protected from spambots. You need JavaScript enabled to view it.
49
University College Dublin, Belfield, Dublin 4, Ireland
50
INAF-Istituto di Astrofisica Spaziale e Fisica
Cosmica, 20133
Milano,
Italy
51
Agenzia Spaziale Italiana (ASI) Science Data Center,
00044
Frascati ( Roma), Italy
52
Center for Research and Exploration in Space Science and
Technology (CRESST) and NASA Goddard Space Flight Center, Greenbelt, MD
20771,
USA
53
Department of Physics and Center for Space Sciences and
Technology, University of Maryland Baltimore County, Baltimore, MD
21250,
USA
54
Space Science Division, Naval Research Laboratory,
Washington, DC
20375,
USA
55
Department of Computational and Data Sciences, George Mason
University, Fairfax,
VA
22030,
USA
56
Université Bordeaux 1, CNRS/IN2p3, Centre d’Études Nucléaires de
Bordeaux Gradignan, 33175
Gradignan,
France
57
CNRS/IN2P3, Centre d’Études Nucléaires Bordeaux Gradignan, UMR
5797, Gradignan,
33175,
France
58
Dipartimento di Fisica, Università di Udine and Istituto Nazionale
di Fisica Nucleare, Sezione di
Trieste, Gruppo Collegato di Udine, 33100
Udine,
Italy
59
Osservatorio Astronomico di Trieste, Istituto Nazionale di
Astrofisica, 34143
Trieste,
Italy
60
Department of Physical Sciences, Hiroshima
University, Higashi-Hiroshima, Hiroshima
739-8526,
Japan
61
INAF Istituto di Radioastronomia, 40129
Bologna,
Italy
62
Center for Space Plasma and Aeronomic Research (CSPAR), University
of Alabama in Huntsville, Huntsville, AL
35899,
USA
63
Department of Physics, Center for Cosmology and Astro-Particle
Physics, The Ohio State University, Columbus, OH
43210,
USA
64
Science Institute, University of Iceland,
IS-107
Reykjavik,
Iceland
65
Research Institute for Science and Engineering, Waseda
University, 3-4-1, Okubo,
Shinjuku, 169-8555
Tokyo,
Japan
66
Centre d’Étude Spatiale des Rayonnements, CNRS/UPS,
BP 44346, 30128
Toulouse Cedex 4,
France
67
Department of Physics and Department of Astronomy, University of
Maryland, College
Park, MD
20742,
USA
68
Istituto Nazionale di Fisica Nucleare, Sezione di Roma “Tor
Vergata”, 00133
Roma,
Italy
69
Department of Physics and Astronomy, University of
Denver, Denver,
CO
80208,
USA
70
Hiroshima Astrophysical Science Center, Hiroshima
University, Higashi-Hiroshima, 739-8526
Hiroshima,
Japan
71
Institute of Space and Astronautical Science,
JAXA, 3-1-1 Yoshinodai, Chuo-ku,
Sagamihara, 252-5210
Kanagawa,
Japan
72
Max-Planck Institut für extraterrestrische Physik,
85748
Garching,
Germany
73
College of Science, George Mason University, Fairfax, VA 22030,
resident at Naval Research Laboratory, Washington, DC
20375,
USA
74
Santa Cruz Institute for Particle Physics, Department of Physics
and Department of Astronomy and Astrophysics, University of California at Santa
Cruz, Santa Cruz,
CA
95064,
USA
75
NYCB Real-Time Computing Inc., Lattingtown, NY
11560-1025,
USA
76
Department of Chemistry and Physics, Purdue University
Calumet, Hammond,
IN
46323-2094,
USA
77
Partially supported by the International Doctorate on Astroparticle Physics
(IDAPP) program
78
Institució Catalana de Recerca i Estudis Avançats
(ICREA), Barcelona,
Spain
79
Consorzio Interuniversitario per la Fisica Spaziale
(CIFS), 10133
Torino,
Italy
80
INTEGRAL Science Data Centre, 1290
Versoix,
Switzerland
81
NASA Postdoctoral Program Fellow,
USA
82
Dipartimento di Fisica, Università di Roma “Tor
Vergata”, 00133
Roma,
Italy
83
Department of Physics, Royal Institute of Technology
(KTH), AlbaNova,
106 91
Stockholm,
Sweden
84
School of Pure and Applied Natural Sciences, University of
Kalmar, 391 82
Kalmar,
Sweden
Received:
19
November
2010
Accepted:
15
March
2011
Abstract
The high-frequency peaked BL Lac object PKS 2005-489 was the target of a multi-wavelength campaign with simultaneous observations in the TeV γ-ray (H.E.S.S.), GeV γ-ray (Fermi/LAT), X-ray (RXTE, Swift), UV (Swift) and optical (ATOM, Swift) bands. This campaign was carried out during a high flux state in the synchrotron regime. The flux in the optical and X-ray bands reached the level of the historical maxima. The hard GeV spectrum observed with Fermi/LAT connects well to the very high energy (VHE, E > 100 GeV) spectrum measured with H.E.S.S.
Supported by CAPES Foundation, Ministry of Education of Brazil.
© ESO, 2011
with a peak energy between ~5 and 500 GeV. Compared to observations with contemporaneous coverage in the VHE and X-ray bands in 2004, the X-ray flux was ~50 times higher during the 2009 campaign while the TeV γ-ray flux shows marginal variation over the years. The spectral energy distribution during this multi-wavelength campaign was fit by a one zone synchrotron self-Compton model with a well determined cutoff in X-rays. The parameters of a one zone SSC model are inconsistent with variability time scales. The variability behaviour over years with the large changes in synchrotron emission and small changes in the inverse Compton emission does not warrant an interpretation within a one-zone SSC model despite an apparently satisfying fit to the broadband data in 2009.
Key words. galaxies: active – BL Lacertae objects: individual: PKS 2005-489
1. Introduction
PKS 2005-489 is one of the brightest high-frequency peaked BL Lac objects (HBL) in the southern hemisphere. It is located at αJ2000 = 20h09m25.39s, δJ2000 = −48°49′53.7′′ (Johnston et al. 1995) and has a redshift of z = 0.071 (Falomo et al. 1987).
HBL are characterized by two peaks in their spectral energy distribution (SED) which are located in the UV-X-ray and the GeV − TeV band, respectively. These are commonly explained by leptonic models (e.g. Marscher & Gear 1985) as synchrotron and inverse Compton (IC) emission from a population of relativistic electrons upscattering their self-produced synchrotron photons (Synchrotron Self Compton models (SSC)). Also alternative models based on hadronic interactions exist, e.g. Mannheim (1993).
PKS 2005-489 was detected through the Parkes 2.7 GHz survey (Wall et al. 1975) and is part of the 1 Jy catalog (Kühr et al. 1981) of the brightest extragalactic radio sources.
It has been observed during several years by different X-ray satellites and showed very large flux variations in combination with distinct spectral changes. In October−November 1998, a large X-ray flare was detected and monitored with RXTE (Perlman et al. 1999). Shortly before this flare occured, BeppoSAX observations were conducted which revealed a curved X-ray spectrum from 0.1 to 200 keV with photon indices of Γ1 = 2, Γ2 = 2.2 and a break around 2 keV (Tagliaferri et al. 2001).
The first evidence for γ-ray emission was marginally detected (4.3σ) with the EGRET instrument revealing a flux of F(>100 MeV) = (1.3 ± 0.5) × 10-7 cm-2 s-1 (Lin et al. 1999; Nandikotkur et al. 2007). This made PKS 2005-489 one of the few HBL detected by EGRET. Very high energy (VHE, E > 100 GeV) γ-rays from PKS 2005-489 were first detected by the Cherenkov telescope array H.E.S.S. (High Energy Stereoscopic System) (Aharonian et al. 2005). Multi-year studies of the TeV emission by H.E.S.S. together with several multi-wavelength observations are described by the H.E.S.S. Collaboration (2010). The VHE γ-ray spectra can be described by power laws with photon indices varying between 2.9 and 3.7 and hence they are amongst the softest spectra of all VHE γ-ray active galactic nuclei (AGN).
Together with the Fermi Gamma-ray Space Telescope (in operation since June 2008) it is possible to determine the inverse Compton emission peak of PKS 2005-489. Together with simultaneous broadband observations, the underlying emission processes can be studied in more detail. In this paper the results of such a broadband simultaneous multi-wavelength campaign on PKS 2005-489 conducted in 2009 are presented.
2. Multi-wavelength observations and data analysis
A multi-wavelength campaign on PKS 2005-489 was conducted from May 22 to July 2, 2009 with observations by the Cherenkov telescope array H.E.S.S. (High Energy Stereoscopic System), the X-ray satellites RXTE (Rossi X-ray Timing Explorer) and Swift and the optical 75-cm telescope ATOM (Automatic Telescope for Optical Monitoring for H.E.S.S.). The LAT (Large Area Telescope) instrument onboard the Fermi Gamma-ray Space Telescope scans the whole sky within approximately 3 h and hence PKS 2005-489 was regularly monitored during this campaign such that simultaneous information about the brightness and the spectrum of the high energy (HE, 100 MeV < E < 100 GeV) γ-ray emission could be obtained. Hence, for the first time, simultaneous observations have been taken on PKS 2005-489 in the VHE, HE γ-ray, X-ray, UV and optical bands, that can be used for variability and spectral studies. The simultaneous monitoring by Fermi in the GeV and by ATOM in the optical band over a time of 22 months allows the study of the long term behaviour of PKS 2005-489. The time of the multi-wavelength campaign is marked in the long term light curve shown in Fig. 1.
2.1. Very high energy γ-ray data from H.E.S.S.
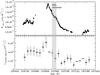 |
Fig. 1 Long term lightcurves of PKS 2005-489 over 22 months of the optical emission (upper panel) by ATOM and the HE γ-ray emission (lower panel) by Fermi/LAT. The HE γ-ray lightcurve is binned with 30 days intervals. The triangles represent upper limits. The major gaps in the optical lightcurve are due to solar conjunction. The grey band indicates the time of the multi-wavelength campaign from May 22 to July 2, 2009. |
The H.E.S.S. experiment consists of four imaging atmospheric Cherenkov telescopes, located in the Khomas Highland, Namibia (23°16′18′′ South, 16°30′00′′ East), at an elevation of 1800 m (Aharonian et al. 2006a). The observations on PKS 2005-489 have been taken with a mean zenith angle of 27° from May 22 to July 2, 2009 with a break around full moon since H.E.S.S. does not observe during moontime. The data have been calibrated as described in Aharonian et al. (2004) and analyzed using the standard cuts resulting in an energy threshold of ≈400 GeV and following the method described in Aharonian et al. (2006a). After the standard quality selection 13 h of live time remain. A total of NON = 953 on-source and NOFF = 5513 off-source events with an on-off normalization factor of α = 0.0932 were measured. An excess of Nγ = NON − αNOFF = 439 γ-rays, corresponding to a significance of 16σ (following the method of Li & Ma 1983), results for PKS 2005-489 within the whole observing period. The reflected-region method (Aharonian et al. 2006a) was used for background subtraction of the spectrum. The same data have been analyzed using a different calibration, resulting in compatible results.
2.2. High energy γ-ray data from Fermi/LAT
The Fermi LAT is a pair-conversion γ-ray detector sensitive to photons in the energy range from below 20 MeV to more than 300 GeV (Atwood et al. 2009). Launched by NASA on June 11, 2008, the LAT began nominal science operations on August 4, 2008. The LAT observations presented here comprise all the data taken between August 4, 2008 and June 4, 2010 (22 months), which fully covers the H.E.S.S. observations taken from May 22 to July 2, 2009. The LAT Science Tools1 version v9r15 were utilized with the post-launch instrument response functions (IRF) P6_V3_DIFFUSE. Events with high probability of being photons, those from the diffuse class, and with zenith angles <105° were selected. Time intervals during which the rocking angle (i.e. the angle Fermi points north or south of the zenith on alternate orbits during sky survey operations) was larger than 52° were excluded to avoid contamination from the Earth’s limb. A cut at 200 MeV was used to avoid the larger systematic uncertainties in the analysis at lower energies. Events with energy between 200 MeV and 300 GeV, and within a 10° region of interest (ROI) centered on the coordinates of PKS 2005-489 were analyzed with an unbinned maximum likelihood method (Cash 1979; Mattox et al. 1996). Some sources from the 1FGL catalog (Abdo et al. 2010) were located outside the ROI but close and bright enough to have a significant impact on the analysis. These sources have been taken into account in the analysis. The background emission was modeled using standard Galactic and isotropic diffuse emission models2. The 1FGL catalog (Abdo et al. 2010) and a Test Statistic (TS, where TS = −2Δlog (likelihood) between models with and without the source) map of the region around PKS 2005-489 were used to identify all the point sources within the ROI. The point sources and PKS 2005-489 were modeled using a power law of the form F(E) = N0(E/E0)−Γ.
The likelihood analysis reveals a point source with a high statistical significance  . The best-fit position of this point source was calculated with gtfindsrc (αJ2000 = 20h09m25.0s, δJ2000 = −48°49′44.4′′) and has a 95% containment radius of 1.5′, consistent with the coordinates of PKS 2005-489. The highest energy photon associated with the source has an energy of ~180 GeV and was detected on March 10, 2009 (i.e. before the start of the H.E.S.S. observations). The highest energy photon detected by Fermi/LAT during the H.E.S.S. multi-wavelength campaign has an energy of ~50 GeV and was detected on June 1, 2009.
2.3. X-ray data from RXTE and Swift/XRT
X-ray observations with the Proportional Counter Array (PCA) detector onboard RXTE (Bradt et al. 1993) were obtained in the energy range 2−60 keV from May 22 to June 3 with exposures of 2−4 ks per pointing, strictly simultaneous with good quality H.E.S.S. observations in 6 nights. Due to the high state of PKS 2005-489 during this campaign, additional Target of Opportunity (ToO) observations have been taken with the X-ray satellites Swift and RXTE. The XRT detector (Burrows et al. 2005) onboard Swift observed in photon-counting (PC) and windowed-timing (WT) mode in the energy range 0.2−10 keV on June 1 and June 24 with ~3 ks each. The RXTE ToO observations were performed from June 30 to July 3, 2009.
For the data analysis of the data obtained with RXTE and Swift, the software package HEASoft3 was used.
Only RXTE/PCA data of PCU2 and the top layer 1 were taken into account to obtain the best signal-to-noise ratio. The data were filtered to account for the influence of the South Atlantic Anomaly, tracking offsets, and electron contamination using the standard criteria recommended by the RXTE Guest Observer Facility (GOF). For the count rate of ~9 cts/s for this observations, the faint background model provided by the RXTE GOF for count rates <40 cts/s was used to generate the background spectrum with pcabackest and the response matrices were created with pcarsp.
The second instrument onboard RXTE, the HEXTE (High Energy X-ray Timing Experiment) is measuring in the energy range 15 to 250 keV. For PKS 2005-489, a signal was detected only in the sum of all observations during the campaign. The fit of a power law to the combined PCA and HEXTE spectrum gives the same result as for the PCA spectrum alone. The combined fit is dominated by the more sensitive PCA detector with a better signal to noise ratio. Hence, the HEXTE spectrum is not discussed further.
For the Swift spectral analysis, XRT exposure maps were generated with xrtpipeline to account for some bad CCD columns that are masked out on-board. The masked hot columns appeared when the XRT CCD was hit by a micrometeoroid. Spectra of the Swift data in PC-mode have been extracted with xselect from an annulus region with an outer radius of 0.8′ at the position of PKS 2005-489, which contains 90% of the PSF at 1.5 keV and an inner radius of ~0.1′ to avoid pileup. An appropriate background was extracted from a circular region with radius of 3′ nearby the source. For the WT-mode, appropriate boxes (~1.6′ × 0.3′) covering the region with source photons and a background region with similar size were used to extract the spectra. The auxiliary response files were created with xrtmkarf and the response matrices were taken from the Swift package of the calibration database caldb 4.1.34.
A power law of the form F(E) = N0(E/E0)−Γ was used to fit the X-ray spectra of each pointing obtained by RXTE in the energy range 3−20 keV resulting in consistent parameters and an average photon index of Γ = 2.46 ± 0.03. During this campaign, no significant change in spectral shape was found. The detailed spectral analysis and results are discussed in Sect. 4.2.
2.4. UV data from Swift/UVOT
The UVOT instrument (Roming et al. 2005) onboard Swift measures the UV emission in the bands u (345 nm), uvw1 (251 nm) and uvw2 (188 nm) simultaneous to the X-ray telescope with an exposure of ~1 ks each. The instrumental magnitudes and the corresponding flux (conversion factors see Poole et al. 2008) are calculated with uvotmaghist taking into account all photons from a circular region with radius 5′′ (standard aperture for all filters). An appropriate background was determined from a circular region with radius 40′′ near the source region without contamination of sources.
The measured UV fluxes have been corrected for dust absorption using E(B − V) = 0.056 mag (Schlegel et al. 1998) and the Aλ/E(B − V) ratios given in Giommi et al. (2006) resulting in a correction of 35%, 29%, 24% for uvw2, uvw1 and u-band, respectively. The contribution of the host galaxy to the measured flux is small compared to the correction for extinction and was not taken into account.
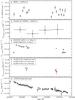 |
Fig. 2 Lightcurves of PKS 2005-489 during the multi-wavelength campaign from May 22 to July 2, 2009 with observations by the Cherenkov telescope array H.E.S.S., the γ-ray space telescope Fermi, the X-ray satellites RXTE and Swift and the 75-cm optical telescope ATOM. For a better display, the u and uvw2 band data by Swift are shifted by ± 0.5 days. For the H.E.S.S., RXTE and Swift lightcurves a nightly binning was used and the Fermi/LAT lightcurve is shown in a 10-day binning. |
2.5. Optical data from ATOM
The 75-cm telescope ATOM (Hauser et al. 2004), located at the H.E.S.S. site in Namibia, monitored the flux in the 4 different filters: B (440 nm), V (550 nm), R (640 nm) and I (790 nm) according to Bessell (1990). The obtained data have been analyzed using an aperture of 4′′ radius and differential photometry with three nearby reference stars from the USNO catalog (Monet & et al. 1998) to determine the apparent magnitudes.
The host galaxy of PKS 2005-489 is a giant elliptical galaxy with a brightness of 14.5mag (R-band) and a half-light radius of 5.6′′ (Scarpa et al. 2000). In order to correct for the host galaxy light, a de Vaucouleur profile of the galaxy was assumed and rescaled to the aperture used in the ATOM photometry. To calculate the influence of the host galaxy in the B, V and I filter, the spectral template for a nearby elliptical galaxy by Fukugita et al. (1995) has been used. The galactic extinction calculated for the ATOM filters is negligible compared to the host galaxy contribution.
3. Temporal analysis
The multiwavelength observations taken from May 22 to July 2 2009 were used to search for variability during the phase of high flux. The lightcurves of this campaign are shown in Fig. 2.
3.1. Variation in different energy bands
Very high energy emission has been detected with a mean flux of F(>300 GeV) = (6.7 ± 0.5) × 10-12 cm-2 s-1 for the time of the campaign. The measured flux level is ~2 times brighter than during the detection of this source in 2004 by H.E.S.S. (H.E.S.S. Collaboration 2010). While no significant long-term trend is detected during the six weeks of observations, a constant flux provides a poor fit with a χ2/d.o.f. = 50/16 and a probability of p < 0.1%. The nightly binned flux shows evidence for variability of about a factor of 2. The low signal to noise ratio does not allow a precise determination of time scales.
PKS 2005-489 was detected by the LAT during the period corresponding to the H.E.S.S. multi-wavelength campaign (TS = 69). Due to the rather faint HE emission, the binning of the light curve for the time period of this campaign was chosen to be 10 days. Within the limited statistics, no variations were detected on these short time scales.
The high X-ray flux of PKS 2005-489 is comparable to the historical maximum of 1998 (Perlman et al. 1999; Tagliaferri et al. 2001). The X-ray flux increased by 10% within the first 2 days of the campaign and decreased until the end of the campaign back to the initial flux level.
The nightly binned u, uvw1 and uvw2-band observations with the Swift/UVOT detector do not show any variation.
The high optical flux measured by ATOM in all 4 filters decreases monotonically by ~20% during this campaign. The colors remained constant with averages of B − R = 1.36 mag, V − R = 0.78 mag and R − I = 0.08 mag.
The long term lightcurves of the optical and HE γ-ray emission of PKS 2005-489 over 22 months is shown in Fig. 1. The maximum in the optical band is clearly identified at 2 454 930.7 JD. The Fermi/LAT light curve displays a variation in the monthly binning with an amplitude similar to the optical variation. A fit with a constant flux results in a poor description with a χ2/d.o.f. = 41 / 17 and a probability of p < 1%. The decrease in the second half of the light curve has a significance of ~4.5σ. In the monthly binning of the light curve, the identification of the maximum is uncertain by ~30 day. Considering this, it is marginally consistent with the maximum of the synchrotron emission.
3.2. Correlations
The highest flux measured in the X-ray band seems to follow the high flux measured in the optical before the beginning of this campaign. In both wavebands a slow decrease could be measured over the time period of this campaign, where the optical flux decreases by ~20% and the X-ray flux by ~10%. The correlation coefficient (also known as Pearson’s correlation) of the optical R-band from ATOM and the X-ray flux from RXTE is 0.7 for the full time range. Considering only the decaying part of the X-ray lightcurve, this factor increases to 0.96. A change of similar amplitude could not be detected with the Fermi/LAT due to the large uncertainties.
Interestingly, the variation in the VHE flux, e.g. the increase in flux between 2 454 978 and 2 454 982 JD is not seen in the simultaneous X-ray and optical observations which do not vary significantly during this period.
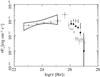 |
Fig. 3 The γ-ray energy spectra of PKS 2005-489 covering the inverse Compton peak of the spectral energy distribution. In black, the γ-ray spectra (Fermi/LAT as butterfly and H.E.S.S. as circles) of this simultaneous multi-wavelength campaign are denoted. In grey open symbols, historical and time-averaged data are shown: triangles represent the Fermi/LAT spectrum from 22 months of observations and the squares show the integrated H.E.S.S. spectrum extracted from observations from 2004 to 2007 (H.E.S.S. Collaboration 2010). Dark grey bars denote the VHE γ-ray spectrum of 2009, corrected for the absorption by the extragalactic background light. The size of the bar reflects the highest and smallest correction, including the statistical and systematic uncertainties, using the models by Aharonian et al. (2006b) and Franceschini et al. (2008). |
4. Spectral energy distribution
For the first time, simultaneous observations from optical to VHE have been obtained on PKS 2005-489, providing a very good coverage of the emission peaks seen in the spectral energy distribution (SED) (see Figs. 3 and 4).
4.1. Spectral data in the γ-ray range
The measured very high energy spectrum by H.E.S.S. (see Fig. 3) during the period of this campaign, can be described by a power law (N(E) = N0 × (E/E0)−Γ) with a normalization of N0 = (2.1 ± 0.2stat ± 0.4sys) × 10-12 cm-2 s-1 TeV-1 at E0 = 1 TeV and a spectral index of Γ = 3.0 ± 0.1stat ± 0.2sys (χ2/d.o.f. = 13/4). The subscripts refer to statistical and systematic uncertainties. A power law with an exponential cutoff with a normalization of N0 = (1.1 ± 0.6stat ± 0.2sys) × 10-11 cm-2 s-1 TeV-1 at E0 = 0.5TeV, a photon index of Γ = 1.3 ± 0.6stat ± 0.2sys and a cutoff at Ecutoff = 1.3 ± 0.5statTeV is a much better description than the simple power law.
This VHE spectrum has been corrected for the absorption by the extragalactic background light (EBL) using the models by Aharonian et al. (2006b) and Franceschini et al. (2008). In Fig. 3 the minima and maxima of this correction are shown to illustrate the uncertainties of this correction. Since the measurement errors cover the uncertainties using different EBL models, only one model has been chosen for the overall SED shown in Fig. 4.
The time averaged very high energy spectrum from 2004–2007 (shown in Fig. 3) can be described by a power law with a spectral index of Γ = 3.2 ± 0.16stat ± 0.1sys, consistent with the one obtained during this campaign but does not show significant curvature (H.E.S.S. Collaboration 2010).
During this campaign PKS 2005-489 shows a marginally harder TeV spectrum than during its TeV detection in 2004 (H.E.S.S. Collaboration 2010) when the softest spectrum of a TeV blazar with spectral index of Γ = 3.7 ± 0.4stat ± 0.1sys was measured. This spectrum, obtained in 2004, with contemporaneous X-ray, UV and optical observations is shown in Fig. 4 for comparison. Most noticeable in the comparison is the indication of a cutoff in the VHE spectrum of this campaign and the different normalizations which suggest a change of the inverse Compton peak to higher energies in 2009. The VHE spectrum resulting from this multi-wavelength campaign and from 2004 have been corrected for the absorption by the EBL using the model by Franceschini et al. (2008) and are shown in Fig. 4.
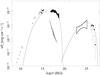 |
Fig. 4 Spectral energy distribution of PKS2005-489 during this multi-wavelength campaign with simultaneous observations by H.E.S.S., Fermi/LAT, RXTE, Swift and ATOM (black symbols) using the time range shown in Fig. 1. The spectra shown here are corrected for Galactic extinction, NH absorption, and EBL absorption. The size of the symbols for the optical data represent the flux range measured. The deabsorbed X-ray and TeV spectra of PKS 2005-489 in 2004 (H.E.S.S. Collaboration 2010), as well as historical IR and radio observations are shown in grey. The black curves represent a one zone SSC model as described in the text. |
The averaged Fermi/LAT photon spectrum during the time of this campaign is fitted by a power law for which the normalization constant N0 is (0.62 ± 0.04stat ± 0.02sys) × 10-12 cm-2 s-1 MeV-1, the spectral index Γ is 1.79 ± 0.05stat ± 0.07sys, and E0 = 2385 MeV is the energy at which the correlation between the fitted values of the normalization constant and the spectral index is minimized. Changing the model of the spectrum to a log-parabola does not improve the quality of the spectral fit significantly. Spectral points were obtained by dividing the data into six equal logarithmically-spaced energy bands. A separate likelihood analysis was run over each band. For all sources in the model of the region, the index was frozen to the time-independent best-fit value, and the flux was left free to vary.
PKS 2005-489 is too faint in the HE band to obtain spectral points for the epoch of the H.E.S.S. multi-wavelength campaign. A 1-sigma error contour (butterfly) was calculated using the covariance matrix produced during the gtlike likelihood fit (Abdo et al. 2009). The full energy range (200 MeV–300 GeV) was used for the fit but the butterfly was extended to only 50 GeV to include the highest energy photon detected during the multi-wavelength campaign.
The HE spectral points obtained for the 22-month period and the butterfly calculated for the H.E.S.S. multi-wavelength campaign are shown in Fig. 3.
4.2. Spectral data in the synchrotron range
PKS 2005-489 was in a very high X-ray state during this campaign with a maximum flux comparable to the historical maximum of 1998. The spectrum during the 2009 campaign was determined from the sum of all RXTE and Swift observations. In the energy range of 0.3−20 keV it can be described by a broken power law with Γ1 = 2.02 ± 0.01, Γ2 = 2.46 ± 0.01, break energy at 3.2 ± 0.2keV and a normalisation of N0 = (5.80 ± 0.06) × 10-2 cm-2 s-1 keV-1 at E0 = 1 keV (χ2/d.o.f. = 582/373), using the Galactic absorption of 3.94 × 1020 cm-2 (LAB Survey, Kalberla et al. 2005) as a fixed parameter. This spectrum by RXTE and Swift corrected for the Galactic absorption is shown in Fig. 4. The integrated flux between 2 and 10 keV is F(2−10keV) = (1.23 ± 0.01) × 10-10 erg cm-2 s-1 which is a factor of ~100 higher than the integrated flux of the XMM-Newton observation in 2004 (H.E.S.S. Collaboration 2010) while the monochromatic flux at 2 keV is ~50 times higher than in 2004.
The two X-ray instruments had different sampling patterns. Since variability was detected during the entire campaign, a joint spectral fit was obtained on June 1, 2009. The derived broken power law model was fit, resulting in Γ1 = 2.04 ± 0.02, Γ2 = 2.50 ± 0.07, break energy at 3.8 ± 0.4keV and a normalisation of N0 = (5.72 ± 0.07) × 10-2 cm-2 s-1 keV-1 at E0 = 1 keV (χ2/d.o.f. = 493/302), which is consistent to the fit of the summed spectra. The integrated flux is F(2−10keV) = (1.23 ± 0.01) × 10-10 erg cm-2 s-1.
In Fig. 4 a dip at the low energy end of the X-ray spectrum can be seen. As discussed by Godet et al. (2009), the most likely explanation for this feature is a detector effect.
The spectrum obtained during the historical maximum on November 10, 1998 is described by a power law of Γ = 2.35 ± 0.02 with a flux of F(2−10keV) = 3.3 × 10⁻¹⁰ erg cm-2 s-1(Perlman et al. 1999). The BeppoSAX spectrum, obtained eight days before on November 1–2, could be fitted with a broken power law with Γ1 = 2.02 ± 0.04, Γ2 = 2.21 ± 0.02, Ebreak = 1.9 ± 0.4 keV (F(2−10keV) = 1.8 × 10⁻¹⁰ erg cm-2 s-1) using a fixed Galactic absorption of 4.2 × 1020 cm-2 (Tagliaferri et al. 2001). Compared to the spectral shape of these observations, the high energy photon index of the broken power law detected in the 2009 campaign is higher (ΔΓ ≈ 0.3) and the peak is at a slightly higher energy. Since the spectrum at the time of the historical maximum was obtained with RXTE in the energy range 2−10 keV, a spectral break <2−3keV cannot be ruled out.
IR observations have been obtained between September 28 and October 1, 1998 with the 2.5 m Telescope at the Las Campanas Observatory using the NIR camera with Js (1.24 μm), H (1.65 μm), Ks (2.16 μm) (Cheung et al. 2003). The observed fluxes were corrected for the influence of the host galaxy in these bands and are shown in Fig. 4. PKS 2005-489 is also detected in the frequencies 12 μm, 25 μm, 60 μm with the Infrared Astronomical Satellite (IRAS) as mentioned in the IRAS faint source catalog v25 (Moshir 1990).
Radio observations of PKS 2000-489 with the Australian Telescope Compact Array (ATCA) at the frequencies 8.6, 4.8, 2.5, 1.4 GHz have been done from October 1996 to February 2000 (Tingay et al. 2003). It was also observed with ATCA in the frequencies 18.5 GHz and 22 GHz in March 2002 (Ricci et al. 2006) during measurements of all sources of the 5 GHz 1 Jy-catalog (Kühr et al. 1981).
PKS 2005-489 is known to be variable in the synchrotron range, therefore the historical IR and radio observations are not taken into account for the SED modelling.
4.3. SED model
The multi-wavelength data obtained during this campaign cover well the two emission peaks in the spectral energy distribution (see Fig. 4) allowing the simultaneous determination of the peak energies and fluxes of the two spectral components.
A one zone SSC model using the code by Krawczynski et al. (2004) has been applied to create a model that can describe the simultaneously observed multi-wavelength SED of this campaign.
The specific spectral shape (broken power law) in the X-ray band is a strong restriction for the cutoff in the synchrotron emission and therefore limits the maximum energy of the electron distribution. The optical, UV and X-ray spectra describing the synchrotron emission restrict the parameters of the electron distribution. This distribution can be described by a broken power law with indices n1 = 2 and n2 = 3, as well as the minimum Emin = 7.9 × 10⁸ eV (γ = 1.5 × 10³), break Eb = 2 × 10¹⁰ eV (γ = 3.9 × 10⁴) and maximum energy Emax = 1 × 10¹² eV (γ = 2 × 10⁶). The high energy power law photon index has been chosen such that the flat shape of the SED in the UV to X-ray range is reproduced. The difference in indices of the broken power law follows the standard break due to cooling (n2 − n1 = 1).
In order to explain the measured inverse Compton emission in view of the large separation to the synchrotron peak, the remaining parameters describing the emission volume were chosen as 15 for the Doppler factor, R = 4 × 1017 cm for the radius and 0.02G for the magnetic field. The Doppler factor of 15 was found to be the smallest possible to reproduce the measured shape. The resulting SSC model can well describe the measured broadband SED. However, this leads to R/δ by a factor of ≈3 larger (corresponding to a variability time scale of approx. 9 days) than the value determined from the variability time scale of a few days detected for the source. In order to correct this, a Doppler factor of around 50 would be needed, but this would lead to a lower synchrotron peak frequency and the cutoff in the synchrotron emission detected in the X-ray band can not be described after adjusting the parameters to reduce the large fluxes resulting from the high Doppler factor.
The parameters of the SSC model optimized for the broadband spectra are close to equipartition (kinetic energy density is ≈3 × 10⁻⁵ erg cm-3, magnetic energy density is ≈2 × 10⁻⁵ erg cm-3), although this was not a restriction for the model. The energy of the emitting electrons contained in the emission region of the jet, that is responsible for the broadband emission up to very high energies, is E ≈ 9 × 1048 erg.
Despite the overall match, this one component synchrotron model is disfavoured by the variability characteristics, e.g. the variability time scale of some days, described in Sect. 3. In light of the inability of the one-zone SSC model to explain the variability, the use of such a model as a physical representation of the blazar jet should be considered an approximation.
Comparison of the high synchrotron state in this 2009 multi-wavelength campaign to earlier observations would require changes to the SSC model. Between 2004 and 2009 the X-ray flux changed by a factor of ~50 and the spectrum changed from a broken power law with photon indices of Γ1 = 3.1 and Γ2 = 2.6 and a break at 2.5 keV (H.E.S.S. Collaboration 2010) to a broken power law with photon indices Γ1 = 2.0 and Γ2 = 2.5 and with a break at 3.8 keV as can be seen in Fig. 4. During this time the TeV emission showed small variation in flux with no significant change in slope. No trivial change in parameters of the one zone SSC model used to represent the 2009 multi-wavelength spectra can describe the steep X-ray spectrum measured in 2004. The specific change in shape of the synchrotron emission peak can be sketched using indices of n1 = 2 and n2 = 4.8 for the broken power law of the electron distribution. But this would mean an arbitrary change of 2.8 of the photon indices lacking any physics basis. Multi-component models do not have this problem. However, given the wavelength coverage and the limited signal-to-noise in fine time-bins, multi-component models remain ambiguous.
As shown in H.E.S.S. Collaboration (2010), between 2004 and 2005, the X-ray flux increased by a factor of ~16 without significant increase of the TeV flux. With the large X-ray flux state detected in 2009, the difference in the X-ray flux to 2004 is much higher (factor of ~50) with still only marginal increase of the TeV flux by ~2.
5. Summary and conclusions
A broadband multi-wavelength campaign on PKS 2005-489 with, for the first time, simultaneous observations in the VHE γ-ray (by H.E.S.S.), HE γ-ray (Fermi/LAT), X-ray (RXTE, Swift), UV (Swift) and optical (ATOM, Swift) band has been conducted between May 22 and July 2, 2009. PKS 2005-489 was observed in a very bright X-ray state, comparable to the historical maximum. The optical flux at the beginning of the campaign was also the highest in several years. For the first time such a high state in synchrotron emission for PKS 2005-489 was covered by γ-ray observations with Fermi/LAT and H.E.S.S. Variability in the VHE γ-ray emission and a decrease in flux in the X-ray and optical bands were detected. Considering a longer time range of 22 months, variations could be detected in the HE γ-ray band with an amplitude similar to the variation of the optical emission.
The simultaneously measured hard HE spectrum connects well to the VHE spectrum resulting in a peak of the inverse Compton emission between ~5 and ~500 GeV. These characteristics are compatible with the long term behaviour in the γ-ray band, while the inverse Compton peak is at higher energies during this campaign due to the higher VHE flux and the curved spectrum measured. The observed X-ray spectrum obtained during the campaign shows a clear break at ~4 keV indicating the cutoff of the synchrotron emission. The hard photon index up to the break energy is one of the main differences of previous X-ray observations in a lower flux state.
These multi-wavelength observations cover well the two emission peaks in the spectral energy distribution. A one zone SSC model was used to fit the broadband spectra. The characteristic broken power law shape of the X-ray spectrum yields a clear break of the synchrotron emission, restricting the parameter range of the SSC model.
In comparison with previous observations in the X-ray and TeV γ-ray range of 2004 (H.E.S.S. Collaboration 2010), the X-ray flux has changed by a factor of ~50 while the VHE γ-ray flux shows smaller variations by a factor of ~2. This large change in synchrotron emission with very small changes in inverse Compton emission is unusual for high-frequency peaked BL Lac objects. Especially the change in spectral shape in the X-ray range between 2004 and 2009 is not reflected in the inverse Compton range.
The prominent TeV blazars, Mrk 421 and PKS 2155-304, have been observed simultaneously in the X-ray and VHE band several times. An interesting aspect of study is the relation of the X-ray and VHE flux during different flaring states of these sources. For PKS 2155-304 a cubic relation ( ) was found during a flare in 2006 (Aharonian et al. 2009a), which means that the VHE flux showed a much stronger variation than the X-ray flux. For Mrk 421, a period with several flares occured in 2001, which was covered by observations of RXTE, Whipple and HEGRA (Fossati et al. 2008). The resulting relations of the X-ray and VHE flux changed from β = 0.5 to β = 2 (
 ) (Fossati et al. 2008). The simultaneous X-ray and VHE measurement of PKS 2005-489 in 2004 and 2009 exhibit a different behaviour. The X-ray flux varies strongly while VHE fluxes hardly change which yield β = 0.2. Contrary to the other sources, this may imply that during the flare the electron population changes such that the IC scattering occurs predominantly in the Klein-Nishina regime, which has lower efficiency for production of TeV photons, while it is (largely) in the Thomson regime during quiescence.
The huge changes in synchrotron emission with small changes in inverse Compton emission over the years between low and high flux states in the synchrotron branch of PKS 2005-489 challenge the applicability of a one zone SSC model to this source. A similar conclusion about the limitations of a one-zone SSC model was reached for the multi-wavelength campaign on PKS 2155-304 (Aharonian et al. 2009b). Results such as these emphasize the need for sustained or repeated multi-wavelength campaigns to measure spectral variability.
Acknowledgments
The support of the Namibian authorities and of the University of Namibia in facilitating the construction and operation of H.E.S.S. is gratefully acknowledged, as is the support by the German Ministry for Education and Research (BMBF), the Max Planck Society, the French Ministry for Research, the CNRS-IN2P3 and the Astroparticle Interdisciplinary Programme of the CNRS, the UK Science and Technology Facilities Council (STFC), the IPNP of the Charles University, the Polish Ministry of Science and Higher Education, the South African Department of Science and Technology and National Research Foundation, and by the University of Namibia. We appreciate the excellent work of the technical support staff in Berlin, Durham, Hamburg, Heidelberg, Palaiseau, Paris, Saclay, and in Namibia in the construction and operation of the equipment.
The Fermi LAT Collaboration acknowledges generous ongoing support from a number of agencies and institutes that have supported both the development and the operation of the LAT as well as scientific data analysis. These include the National Aeronautics and Space Administration and the Department of Energy in the United States, the Commissariat à l’Energie Atomique and the Centre National de la Recherche Scientifique/Institut National de Physique Nucléaire et de Physique des Particules in France, the Agenzia Spaziale Italiana and the Istituto Nazionale di Fisica Nucleare in Italy, the Ministry of Education, Culture, Sports, Science and Technology (MEXT), High Energy Accelerator Research Organization (KEK) and Japan Aerospace Exploration Agency (JAXA) in Japan, and the K. A. Wallenberg Foundation, the Swedish Research Council and the Swedish National Space Board in Sweden.
Additional support for science analysis during the operations phase is gratefully acknowledged from the Istituto Nazionale di Astrofisica in Italy and the Centre National d’Études Spatiales in France.
The authors acknowledge the support by the RXTE and Swift teams for providing ToO observations and the use of the public HEASARC software packages. S.K. and S.W. acknowledge support from the BMBF through grant DLR 50OR0906.
References
- Abdo, A. A., Ackermann, M., Ajello, M., et al. (Fermi-LAT Collaboration) 2010, ApJS, 188, 405 [NASA ADS] [CrossRef] [Google Scholar]
- Abdo, A. A., Ackermann, M., Ajello, M., et al. (Fermi-LAT Collaboration) 2009, ApJ, 707, 1310 [NASA ADS] [CrossRef] [Google Scholar]
- Aharonian, F., Akhperjanian, A. G., Anton, G., et al. (H.E.S.S. Collaboration) 2009a, A&A, 502, 749 [NASA ADS] [CrossRef] [EDP Sciences] [Google Scholar]
- Aharonian, F., Akhperjanian, A. G., Anton, G., et al. (H.E.S.S. Collaboration & Fermi-LAT Collaboration) 2009b, ApJ, 696, L150 [NASA ADS] [CrossRef] [Google Scholar]
- Aharonian, F., Akhperjanian, A. G., Aye, K.-M., et al. (H.E.S.S. Collaboration) 2005, A&A, 436, L17 [NASA ADS] [CrossRef] [EDP Sciences] [Google Scholar]
- Aharonian, F., Akhperjanian, A. G., Aye, K.-M., et al. (H.E.S.S. Collaboration) 2004, Astrop. Phys., 22, 109 [NASA ADS] [CrossRef] [Google Scholar]
- Aharonian, F., Akhperjanian, A. G., Bazer-Bachi, A. R., et al. (H.E.S.S. Collaboration) 2006a, A&A, 457, 899 [NASA ADS] [CrossRef] [EDP Sciences] [Google Scholar]
- Aharonian, F., Akhperjanian, A. G., Bazer-Bachi, A. R., et al. (H.E.S.S. Collaboration) 2006b, Nature, 440, 1018 [NASA ADS] [CrossRef] [PubMed] [Google Scholar]
- Atwood, W. B., Abdo, A. A., Ackermann, M., et al. (Fermi-LAT Collaboration) 2009, ApJ, 697, 1071 [NASA ADS] [CrossRef] [Google Scholar]
- Bessell, M. S. 1990, PASP, 102, 1181 [NASA ADS] [CrossRef] [Google Scholar]
- Bradt, H. V., Rothschild, R. E., & Swank, J. H. 1993, A&AS, 97, 355 [NASA ADS] [Google Scholar]
- Burrows, D. N., Hill, J. E., Nousek, J. A., et al. 2005, Space Sci. Rev., 120, 165 [NASA ADS] [CrossRef] [Google Scholar]
- Cash, W. 1979, ApJ, 228, 939 [NASA ADS] [CrossRef] [Google Scholar]
- Cheung, C. C., Urry, C. M., Scarpa, R., & Giavalisco, M. 2003, ApJ, 599, 155 [NASA ADS] [CrossRef] [Google Scholar]
- Falomo, R., Maraschi, L., Treves, A., & Tanzi, E. G. 1987, ApJ, 318, L39 [NASA ADS] [CrossRef] [Google Scholar]
- Fossati, G., Buckley, J. H., Bond, I. H., et al. 2008, ApJ, 677, 906 [NASA ADS] [CrossRef] [Google Scholar]
- Franceschini, A., Rodighiero, G., & Vaccari, M. 2008, A&A, 487, 837 [NASA ADS] [CrossRef] [EDP Sciences] [Google Scholar]
- Fukugita, M., Shimasaku, K., & Ichikawa, T. 1995, PASP, 107, 945 [NASA ADS] [CrossRef] [Google Scholar]
- Giommi, P., Blustin, A. J., Capalbi, M., et al. 2006, A&A, 456, 911 [NASA ADS] [CrossRef] [EDP Sciences] [Google Scholar]
- Godet, O., Beardmore, A. P., Abbey, A. F., et al. 2009, A&A, 494, 775 [NASA ADS] [CrossRef] [EDP Sciences] [Google Scholar]
- Hauser, M., Möllenhoff, C., Pühlhofer, G., et al. 2004, Astron. Nachr., 325, 659 [Google Scholar]
- H.E.S.S. Collaboration. 2010, A&A, 511, 52 [Google Scholar]
- Johnston, K. J., Fey, A. L., Zacharias, N., et al. 1995, AJ, 110, 880 [NASA ADS] [CrossRef] [Google Scholar]
- Kalberla, P. M. W., Burton, W. B., Hartmann, D., et al. 2005, A&A, 440, 775 [NASA ADS] [CrossRef] [EDP Sciences] [Google Scholar]
- Krawczynski, H., Hughes, S. B., Horan, D., et al. 2004, ApJ, 601, 151 [NASA ADS] [CrossRef] [Google Scholar]
- Kühr, H., Witzel, A., Pauliny-Toth, I. I. K., & Nauber, U. 1981, A&AS, 45, 367 [NASA ADS] [Google Scholar]
- Li, T., & Ma, Y. 1983, ApJ, 272, 317 [NASA ADS] [CrossRef] [Google Scholar]
- Lin, Y. C., Bertsch, D. L., Bloom, S. D., et al. 1999, ApJ, 525, 191 [NASA ADS] [CrossRef] [Google Scholar]
- Mannheim, K. 1993, A&A, 269, 67 [NASA ADS] [Google Scholar]
- Marscher, A. P., & Gear, W. K. 1985, ApJ, 298, 114 [NASA ADS] [CrossRef] [Google Scholar]
- Mattox, J. R., Bertsch, D. L., Chiang, J., et al. 1996, ApJ, 461, 396 [NASA ADS] [CrossRef] [Google Scholar]
- Monet, D. et al. 1998, VizieR Online Data Catalog, 1252, [Google Scholar]
- Moshir, M. 1990, in IRAS Faint Source Catalogue, version 2.0 [Google Scholar]
- Nandikotkur, G., Jahoda, K. M., Hartman, R. C., et al. 2007, ApJ, 657, 706 [NASA ADS] [CrossRef] [Google Scholar]
- Perlman, E. S., Madejski, G., Stocke, J. T., & Rector, T. A. 1999, ApJ, 523, L11 [NASA ADS] [CrossRef] [Google Scholar]
- Poole, T. S., Breeveld, A. A., Page, M. J., et al. 2008, MNRAS, 383, 627 [NASA ADS] [CrossRef] [Google Scholar]
- Ricci, R., Prandoni, I., Gruppioni, C., Sault, R. J., & de Zotti, G. 2006, A&A, 445, 465 [NASA ADS] [CrossRef] [EDP Sciences] [Google Scholar]
- Roming, P. W. A., Kennedy, T. E., Mason, K. O., et al. 2005, Space Sci. Rev., 120, 95 [NASA ADS] [CrossRef] [Google Scholar]
- Scarpa, R., Urry, C. M., Falomo, R., Pesce, J. E., & Treves, A. 2000, ApJ, 532, 740 [NASA ADS] [CrossRef] [Google Scholar]
- Schlegel, D. J., Finkbeiner, D. P., & Davis, M. 1998, ApJ, 500, 525 [NASA ADS] [CrossRef] [Google Scholar]
- Tagliaferri, G., Ghisellini, G., Giommi, P., et al. 2001, A&A, 368, 38 [Google Scholar]
- Tingay, S. J., Jauncey, D. L., King, E. A., et al. 2003, PASJ, 55, 351 [NASA ADS] [Google Scholar]
- Wall, J. V., Shimmins, A. J., & Bolton, J. G. 1975, Aust. J. Phys. Astrophys. Suppl., 34, 55 [NASA ADS] [Google Scholar]
All Figures
|
Fig. 1 Long term lightcurves of PKS 2005-489 over 22 months of the optical emission (upper panel) by ATOM and the HE γ-ray emission (lower panel) by Fermi/LAT. The HE γ-ray lightcurve is binned with 30 days intervals. The triangles represent upper limits. The major gaps in the optical lightcurve are due to solar conjunction. The grey band indicates the time of the multi-wavelength campaign from May 22 to July 2, 2009. |
| In the text | |
|
Fig. 2 Lightcurves of PKS 2005-489 during the multi-wavelength campaign from May 22 to July 2, 2009 with observations by the Cherenkov telescope array H.E.S.S., the γ-ray space telescope Fermi, the X-ray satellites RXTE and Swift and the 75-cm optical telescope ATOM. For a better display, the u and uvw2 band data by Swift are shifted by ± 0.5 days. For the H.E.S.S., RXTE and Swift lightcurves a nightly binning was used and the Fermi/LAT lightcurve is shown in a 10-day binning. |
| In the text | |
|
Fig. 3 The γ-ray energy spectra of PKS 2005-489 covering the inverse Compton peak of the spectral energy distribution. In black, the γ-ray spectra (Fermi/LAT as butterfly and H.E.S.S. as circles) of this simultaneous multi-wavelength campaign are denoted. In grey open symbols, historical and time-averaged data are shown: triangles represent the Fermi/LAT spectrum from 22 months of observations and the squares show the integrated H.E.S.S. spectrum extracted from observations from 2004 to 2007 (H.E.S.S. Collaboration 2010). Dark grey bars denote the VHE γ-ray spectrum of 2009, corrected for the absorption by the extragalactic background light. The size of the bar reflects the highest and smallest correction, including the statistical and systematic uncertainties, using the models by Aharonian et al. (2006b) and Franceschini et al. (2008). |
| In the text | |
|
Fig. 4 Spectral energy distribution of PKS2005-489 during this multi-wavelength campaign with simultaneous observations by H.E.S.S., Fermi/LAT, RXTE, Swift and ATOM (black symbols) using the time range shown in Fig. 1. The spectra shown here are corrected for Galactic extinction, NH absorption, and EBL absorption. The size of the symbols for the optical data represent the flux range measured. The deabsorbed X-ray and TeV spectra of PKS 2005-489 in 2004 (H.E.S.S. Collaboration 2010), as well as historical IR and radio observations are shown in grey. The black curves represent a one zone SSC model as described in the text. |
| In the text | |
Current usage metrics show cumulative count of Article Views (full-text article views including HTML views, PDF and ePub downloads, according to the available data) and Abstracts Views on Vision4Press platform.
Data correspond to usage on the plateform after 2015. The current usage metrics is available 48-96 hours after online publication and is updated daily on week days.
Initial download of the metrics may take a while.