Fig. 4
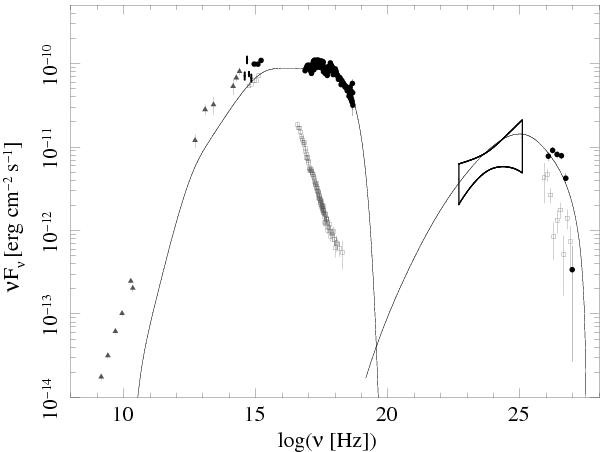
Spectral energy distribution of PKS2005-489 during this multi-wavelength campaign with simultaneous observations by H.E.S.S., Fermi/LAT, RXTE, Swift and ATOM (black symbols) using the time range shown in Fig. 1. The spectra shown here are corrected for Galactic extinction, NH absorption, and EBL absorption. The size of the symbols for the optical data represent the flux range measured. The deabsorbed X-ray and TeV spectra of PKS 2005-489 in 2004 (H.E.S.S. Collaboration 2010), as well as historical IR and radio observations are shown in grey. The black curves represent a one zone SSC model as described in the text.
Current usage metrics show cumulative count of Article Views (full-text article views including HTML views, PDF and ePub downloads, according to the available data) and Abstracts Views on Vision4Press platform.
Data correspond to usage on the plateform after 2015. The current usage metrics is available 48-96 hours after online publication and is updated daily on week days.
Initial download of the metrics may take a while.