Fig. 3
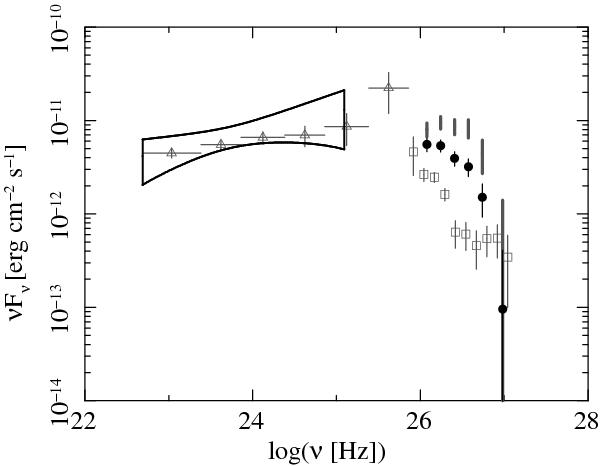
The γ-ray energy spectra of PKS 2005-489 covering the inverse Compton peak of the spectral energy distribution. In black, the γ-ray spectra (Fermi/LAT as butterfly and H.E.S.S. as circles) of this simultaneous multi-wavelength campaign are denoted. In grey open symbols, historical and time-averaged data are shown: triangles represent the Fermi/LAT spectrum from 22 months of observations and the squares show the integrated H.E.S.S. spectrum extracted from observations from 2004 to 2007 (H.E.S.S. Collaboration 2010). Dark grey bars denote the VHE γ-ray spectrum of 2009, corrected for the absorption by the extragalactic background light. The size of the bar reflects the highest and smallest correction, including the statistical and systematic uncertainties, using the models by Aharonian et al. (2006b) and Franceschini et al. (2008).
Current usage metrics show cumulative count of Article Views (full-text article views including HTML views, PDF and ePub downloads, according to the available data) and Abstracts Views on Vision4Press platform.
Data correspond to usage on the plateform after 2015. The current usage metrics is available 48-96 hours after online publication and is updated daily on week days.
Initial download of the metrics may take a while.