Fig. 1
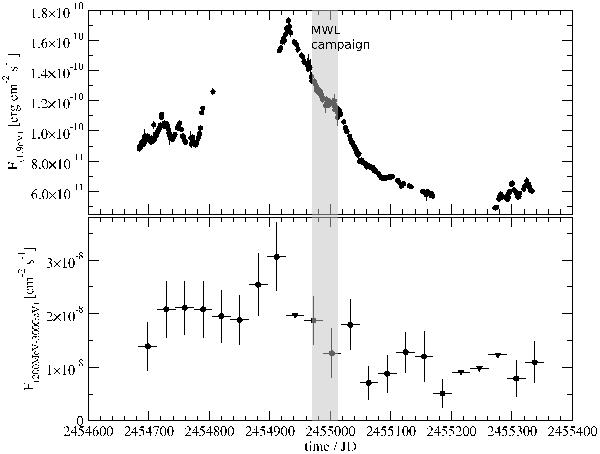
Long term lightcurves of PKS 2005-489 over 22 months of the optical emission (upper panel) by ATOM and the HE γ-ray emission (lower panel) by Fermi/LAT. The HE γ-ray lightcurve is binned with 30 days intervals. The triangles represent upper limits. The major gaps in the optical lightcurve are due to solar conjunction. The grey band indicates the time of the multi-wavelength campaign from May 22 to July 2, 2009.
Current usage metrics show cumulative count of Article Views (full-text article views including HTML views, PDF and ePub downloads, according to the available data) and Abstracts Views on Vision4Press platform.
Data correspond to usage on the plateform after 2015. The current usage metrics is available 48-96 hours after online publication and is updated daily on week days.
Initial download of the metrics may take a while.