| Issue |
A&A
Volume 532, August 2011
|
|
|---|---|---|
| Article Number | L7 | |
| Number of page(s) | 5 | |
| Section | Letters | |
| DOI | https://doi.org/10.1051/0004-6361/201117411 | |
| Published online | 21 July 2011 | |
Letter to the Editor
Inhomogeneities in molecular layers of Mira atmospheres⋆,⋆⋆
1
ESO, Karl-Schwarzschild-Str. 2, 85748 Garching bei München, Germany
e-mail: This email address is being protected from spambots. You need JavaScript enabled to view it.
2
US Naval Observatory, 3450 Massachusetts Avenue, NW, Washington, DC 20392-5420, USA
3 Department of Physics and Astronomy, Macquarie University NSW 2109, Australia
4
Australian Astronomical Observatory, PO Box 296, Epping, NSW 1710, Australia
5
Max-Planck-Institut für Radioastronomie, Auf dem Hügel 69, 53121 Bonn, Germany
6
Zentrum für Astronomie der Universität Heidelberg (ZAH), Institut für Theoretische Astrophysik, Albert-Ueberle-Str. 2, 69120 Heidelberg, Germany
7
Sydney Institute for Astronomy, School of Physics, University of Sydney, Sydney NSW 2006, Australia
8
South African Astronomical Observatory (SAAO), PO Box 9, 7935 Observatory, South Africa
9
Astrophysics, Cosmology and Gravitation Centre, Astronomy Dept., University of Cape Town, 7701 Rondebosch, South Africa
10
Research School of Astronomy and Astrophysics, The Australian National University, Canberra, Australia
11
School of Physics & Astronomy, University of Manchester, PO Box 88, Manchester M60 1QD, UK
Received: 6 June 2011
Accepted: 2 July 2011
Abstract
Aims. We investigate the structure and shape of the photospheric and molecular layers of the atmospheres of four Mira variables.
Methods. We obtained near-infrared K-band spectro-interferometric observations of the Mira variables R Cnc, X Hya, W Vel, and RW Vel with a spectral resolution of about 1500 using the AMBER instrument at the VLTI. We obtained concurrent JHKL photometry using the the Mk II instrument at the SAAO.
Results. The Mira stars in our sample are found to have wavelength-dependent visibility values that are consistent with earlier low-resolution AMBER observations of S Ori and with the predictions of dynamic model atmosphere series based on self-excited pulsation models. The corresponding wavelength-dependent uniform disk (UD) diameters show a minimum near the near-continuum bandpass at 2.25 μm. They then increase by up to 30% toward the H2O band at 2.0 μm and by up to 70% at the CO bandheads between 2.29 μm and 2.48 μm. The dynamic model atmosphere series show a consistent wavelength-dependence, and their parameters such as the visual phase, effective temperature, and distances are consistent with independent estimates. The closure phases have significantly wavelength-dependent and non-zero values at all wavelengths indicating deviations from point symmetry. For example, the R Cnc closure phase is 110° ± 4° in the 2.0 μm H2O band, corresponding for instance to an additional unresolved spot contributing 3% of the total flux at a separation of ~4 mas.
Conclusions. Our observations are consistent with the predictions of the latest dynamic model atmosphere series based on self-excited pulsation models. The wavelength-dependent radius variations are interpreted as the effect of molecular layers lying above the photosphere. The wavelength-dependent closure phase values are indicative of deviations from point symmetry at all wavelengths, thus a complex non-spherical stratification of the extended atmosphere. In particular, the significant deviation from point symmetry in the H2O band is interpreted as a signature on large scales (there being a few across the stellar disk) of inhomogeneities or clumps in the water vapor layer. The observed inhomogeneities might possibly be caused by pulsation- and shock-induced chaotic motion in the extended atmosphere.
Key words: techniques: interferometric / techniques: photometric / stars: AGB and post-AGB / stars: atmospheres / stars: fundamental parameters / stars: mass-loss
Based on observations made with the VLT Interferometer (VLTI) at Paranal Observatory under program ID 082.D-0723.
Figure 2 is available in electronic form at http://www.aanda.org
© ESO, 2011
1. Introduction
Mira stars are long-period, large-amplitude variable stars on the asymptotic giant branch (AGB). Mass loss becomes increasingly important toward the tip of the AGB, before the star evolves to the planetary nebula (PN) phase, where a great diversity of morphologies is seen. Contemporary astrophysical questions related to the study of Mira variables include the pursuit of the detailed mass-loss mechanism on the AGB, including the effects of pulsation and shock fronts on the structure and morphology of the extended atmosphere, and of the mechanism shaping the observed PN morphologies. Near-infrared interferometry has traditionally been used to characterize AGB star atmospheres. In particular, observations using the IOTA interferometer have uncovered the wavelength-dependence of Mira star diameters using a few bandpasses with spectral resolutions of up to λ/Δλ ~ 25, providing observational evidence of molecular layers lying outside the photospheric layers (e.g.; Mennesson et al. 2002; Perrin et al. 2004). These molecular layers have also been present in theoretical dynamic model atmospheres (Hofmann et al. 1998; Ireland et al. 2004a,b). H-band interferometry at the IOTA interferometer in the broad band (Ragland et al. 2006), as well as in three filters with λ/Δλ ~ 15 (Ragland et al. 2008; Pluzhnik et al. 2009) have revealed non-zero closure phases for several Mira variables, which reflect asymmetric brightness distributions of the photosphere and/or the envelope around the star. Wittkowski et al. (2008) presented the first VLTI/AMBER near-infrared spectro-interferometric observation of an AGB star, providing continuous wavelength coverage from 1.29 μm to 2.32 μm with a spectral resolution of λ/Δλ ~ 35. The data showed visibility and diameter variations as a function of wavelength that generally confirmed the predictions of dynamic model atmospheres, where the diameter variations can be understood as the effects from atmospheric molecular layers (most importantly H2O, CO, and TiO). Here, we present the first VLTI/AMBER observations of Mira variables using its K medium resolution modes with a spectral resolution of λ/Δλ ~ 1500, and a comparison to the newly available CODEX dynamic model-atmosphere series by Ireland et al. (2008; 2011), which are based on self-excited pulsation models.
2. Observations
Log of our VLTI/AMBER observations.
SAAO JHKL photometry.
We obtained K-band spectro-interferometry with a resolution of λ/Δλ ~ 1500 of the Mira variables R Cnc, X Hya, W Vel, and RW Vel with the AMBER instrument (Petrov et al. 2007) of the VLTI. Table 1 shows the details of our observations. We obtained concurrent near-infrared JHKL photometry of R Cnc, X Hya, and W Vel at the SAAO Mk II instrument. Table 2 lists the obtained photometry and the estimated bolometric magnitudes using the procedures outlined in Whitelock et al. (2008) and their estimates of AV. For R Cnc and X Hya, we obtained additional AMBER and SAAO observations at later epochs/phases, as well as coordinated mid-infrared VLTI/MIDI observations and VLBA observations of the SiO and H2O maser emission. The complete data set for these sources will be discussed in a dedicated forthcoming paper.
Raw visibility and closure phase values were obtained from the AMBER data using version 3.0 of the amdlib data reduction package (Tatulli et al. 2007; Chelli et al. 2009). An absolute wavelength calibration was performed by correlating the AMBER flux spectra with a reference spectrum that includes the AMBER transmission curve, the telluric spectrum estimated with ATRAN (Lord 1992), and the expected stellar spectrum using the BS 4432 spectrum from Lançon & Wood (2000), which has a similar spectral type as our calibrators (K3-4 III). Similarly, a relative flux calibration of the target stars was performed using the calibrator stars and the BS 4432 spectrum. Calibrated visibility spectra were obtained by using an average of two transfer function measurements taken before and after each science target observation. The calibrators were ι Hya (for R Cnc and X Hya), 81 Gem (for R Cnc), 31 Leo (for X Hya), GZ Vel (for W Vel and RW Vel), and γ Pyx (for W Vel), and were selected from Bordé et al. (2002) using the ESO calibrator tool CalVin.
3. Results and comparison to model atmospheres
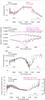 |
Fig. 1 R Cnc flux, squared visibility amplitude, closure phase, and UD diameter (from top to bottom) as a function of wavelength. Data of the remaining three targets are shown in Fig. 2 of the electronic version. The wavelength range is 1.92–2.47 μm (MR21 mode: 1.92–2.26 μm, MR23 mode: range 2.12–2.47 μm). The modes overlap in the region 2.12–2.26 μm, where the two lines appear as one thicker line. The thick vertical lines denote the errors averaged over three wavelength intervals. The blue lines show a comparison to the best fitting model of the P/M model atmosphere series (Ireland et al. 2004a,b), and the red lines the best fitting model of the new CODEX series (Ireland et al. 2008; 2011). The dashed line shows a uniform disk curve fitted to the 2.25 μm near-continuum bandpass. |
Figures 1 and 2 show the resulting AMBER flux, visibility, UD diameter, and closure phase data. The UD diameter curve is obtained by fitting a UD model to the visibility data separately for each spectral channel. We note that the intensity profiles are expected to be more complex than a simple UD model, and this approach is used merely to readily obtain a preliminary estimate of the apparent diameter. Signatures of a more complex model as well as asymmetries are most pronounced near and beyond the first visibility minimum, hence we used the two shorter baselines only for UD fits.
The AMBER data are compared to the P/M dynamic model atmosphere series (Ireland et al. 2004a,b), as well as the newly available CODEX series (Ireland et al. 2008; 2011). Both series are based on self-excited pulsation models. The only fit parameter for each model atmosphere is the Rosseland angular diameter. Figure 1 shows the result of the best-fit model of each of the P/M and CODEX series. Compared to the P/M series, the CODEX series uses the opacity sampling method, and the model series are available for a wider range of basic parameters of the underlying hypothetical non-pulsating parent star. The CODEX intensity profile was tabulated in steps of 0.0005 μm (λ/Δλ = 40 000 at λ = 2 μm), and the synthetic visibility values averaged over the AMBER spectral channels assuming a Gaussian-shaped bandpass. The CODEX series include the series o54 (parent star parameters: M = 1.1 M⊙, L = 5400 L⊙, R = 216 R⊙, P = 330 days), R52 (1.10 M⊙, 5200 L⊙, 209 R⊙, 307 d), C50 (1.35 M⊙, 5050 L⊙, 291 R⊙, 430 d), and C81 (1.35 M⊙, 8160 L⊙, 278 R⊙, 427 d), compared to the previous series P (1.0 M⊙, 3470 L⊙, 241 R⊙, 332 d) and M (1.2 M⊙, 3470 L⊙, 260 R⊙, 260 d). Table 3 provides an overview of the measured and derived quantities of the four targets.
The targets of our sample have a visibility function with a characteristic shape1. For each baseline, it exhibits a maximum near 2.25 μm and decreases towards both shorter and longer wavelengths. At shorter wavelengths, it shows a minimum near 2.0 μm. At longer wavelengths, between 2.3 μm and 2.5 μm, the visibility function displays sharp drops at the locations of the CO bandheads. This characteristic shape of the visibility function of the four targets studied here is consistent with low resolution (λ/ΔΛ ~ 35) AMBER data of the Mira variable S Ori (Wittkowski et al. 2008), but shows additional details thanks to the increased spectral resolution. Figure 1 displays the position of the H2O (1.9–2.1 μm) and CO bands (2.3–2.5 μm, but where H2O may also contribute).
The corresponding wavelength-dependent uniform disk (UD) diameters show a minimum near the near-continuum bandpass at 2.25 μm. They increase toward 2.0 μm, where the H2O opacity is large, by up to ~30%. The CO bandheads between 2.29 μm and 2.48 μm are clearly visible for all targets with an increase in the UD diameter by up to ~70%.
The best-fit models of the P/M and CODEX model series predict visibility and UD curves that are consistent with the observations. Here, the newly available models of the CODEX series provide a closer agreement with the data than the P/M series, at both the locations of the CO bandheads, which may be expected because of the newly introduced opacity sampling method and their higher spectral resolution, and in terms of the overall shape of the curve. The latter may be explained by the availability of more model series with additional parent star parameters and with an increased phase coverage per series. The AMBER flux curves are consistent with those of the dynamic model atmosphere series. In addition, the pulsation phases of the best-fit CODEX models are consistent with the observed visual phases, and their effective temperature is consistent with that derived from the fitted angular Rosseland-mean diameter and the bolometric flux. Furthermore, the distances obtained from the fitted angular diameter and the model radius are consistent with those derived from the measured apparent bolometric magnitude and the model luminosity, as well as with the period-luminosity distance from Whitelock et al. (2008, cf. Table 3) within 1–3σ.
The closure phase functions of our targets exhibit significant wavelength-dependent non-zero values at all wavelengths. Non-zero values of the closure phase are indicative of deviations from point symmetry, here along the projected intensity profile onto the orientation of the position angle given in Table 1. The consistency of the visibility amplitudes with spherical models and the closure phase deviation being more significant for targets that are well-resolved indicates that the deviation from point symmetry originates from sub-structure at a relatively low flux level of an overall spherical intensity distribution. The strongest closure phase signal is obtained for the most clearly resolved target R Cnc. It differs strongly from point-symmetry in the H2O band at 2.0 μm with a value of 110° ± 4°. At the continuum bandpass at 2.25 μm, the closure phase value is closer to 0 with a value of 45° ± 5°. Towards longer wavelengths (CO band), the average value is 153° ± 4°, with values up to 165° in the bandheads, and thus close to a 180° symmetric value. As an illustration, the R Cnc closure phase value in the H2O band can be caused by the addition of an unresolved (up to ~3 mas diameter) spot to a circular disk, contributing up to ~3% of the total flux, i.e. corresponding to the level of the visibility departures between data and spherical models, at a separation of ~4 mas.
Results.
4. Discussion
The four Mira variables of our sample exhibit consistent characteristic wavelength dependences of the visibility and consequently the corresponding uniform disk diameter that are consistent with those of earlier low-resolution AMBER data of the Mira variable S Ori and the predictions of the P/M and CODEX dynamic model atmosphere series. Here, the newly available CODEX series provides a closer agreement with the data than the earlier P/M series. This result confirms that the wavelength-dependent angular diameter is caused by the atmospheric molecular layers, here most importantly H2O and CO, as they are naturally included in the dynamic model atmosphere series. Concurrent JHKL photometry obtained at the SAAO was used to derive Teff based on the integrated bolometric flux and the fitted Rosseland-mean angular diameter. Parameters of the best-fit model atmospheres, such as visual phase, effective temperature, and distances are consistent with independent estimates, which provides additional confidence in the CODEX modeling approach.
The closure phase functions of our targets exhibit non-zero values at all wavelengths with a wavelength dependence that also correlates with the positions of the H2O and CO bands. This result indicates a complex non-spherical stratification of the extended atmosphere of Mira variables. The most significant deviation from point symmetry is observed in the H2O band around 2.0 μm, in particular for the clearly resolved target R Cnc. We interpret this signal as an indication of inhomogeneities or clumps within the water vapor layer on scales of a few resolution elements across the stellar disk. These inhomogeneous water shells have also been detected for the Mira variable U Ori (Pluzhnik et al. 2009) and the symbiotic Mira variable R Aqr (Ragland et al. 2008). The deviations from point symmetry at the near-continuum bandpass may be related either to photospheric convection cells (cf. Freytag & Höfner 2008) or the inhomogeneities of molecular layers that may also contaminate this bandpass.
Inhomogeneous or clumpy molecular layers may be expected as the result of chaotic motion induced by the interaction of pulsation and shock fronts with the extended atmosphere. The CODEX models indicate that the outer mass zones outward of 1.5–2 Rosseland radii are only loosely connected to the stellar pulsation (cf. Fig. 1 of Ireland et al. 2008). Likewise, outer mass zones on different sides of the star may be only weakly correlated with each other and may have different extensions. Icke et al. (1992) described as well that the outer layers of an evolved AGB star may respond with chaotic motion to the pulsations that originate in the stellar interior. Observations of water vapor layers may be particularly sensitive to these effects, but other molecules, such as CO, that are expected to be plentiful in the shocked region of the atmosphere (cf. Cherchneff 2006) would also be affected by this large-scale chaotic motion. The resulting clumpy structure of molecular layers may explain our complex wavelength-dependent closure phase signal.
Further interferometric campaigns with high spatial and spectral resolution are clearly needed to characterize in detail the morphology of atmospheric molecular layers in Mira variables.
Online material
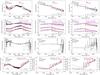 |
Fig. 2 Flux, squared visibility amplitude, closure phase, and uniform disk diameter (from top to bottom) as a function of wavelength for the Mira variables X Hya, W Vel, and RW Vel (from left to right). As Fig. 1, but for the remaining targets of our sample. |
The R Cnc visibility reaches into the second lobe, where the shape is inverted.
Acknowledgments
This research has made use of the AMBER data reduction package of the Jean-Marie Mariotti Center. We acknowledge with thanks the variable star observations from the AAVSO International Database contributed by observers worldwide and used in this research. This research has made use of the AFOEV database, operated at CDS, France.
References
- Bordé, P., du Foresto, V., Chagnon, G., & Perrin, G. 2002, A&A, 393, 183 [NASA ADS] [CrossRef] [EDP Sciences] [Google Scholar]
- Chelli, A., Utrera, O. H., & Duvert, G. 2009, A&A, 502, 705 [NASA ADS] [CrossRef] [EDP Sciences] [Google Scholar]
- Cherchneff, I. 2006, A&A, 456, 1001 [NASA ADS] [CrossRef] [EDP Sciences] [Google Scholar]
- Freytag, B., & Höfner, S. 2008, A&A, 483, 571 [NASA ADS] [CrossRef] [EDP Sciences] [Google Scholar]
- Hofmann, K.-H., Scholz, M., & Wood, P. R. 1998, A&A, 339, 846 [NASA ADS] [Google Scholar]
- Icke, V., Frank, A., & Heske, A. 1992, A&A, 258, 341 [NASA ADS] [Google Scholar]
- Ireland, M. J., Scholz, M., & Wood, P. R. 2004a, MNRAS, 352, 318 [NASA ADS] [CrossRef] [Google Scholar]
- Ireland, M. J., Scholz, M., Tuthill, P., & Wood, P. 2004b, MNRAS, 355, 444 [NASA ADS] [CrossRef] [Google Scholar]
- Ireland, M. J., Scholz, M., & Wood, P. R. 2008, MNRAS, 391, 1994 [NASA ADS] [CrossRef] [Google Scholar]
- Ireland, M. J., Scholz, M., & Wood, P. R. 2011, MNRAS, submitted [Google Scholar]
- Lançon, A., & Wood, P. R. 2000, A&AS, 146, 217 [NASA ADS] [CrossRef] [EDP Sciences] [Google Scholar]
- Lord, S. D. 1992, NASA technical memorandum, 103957 [Google Scholar]
- Mennesson, B., Perrin, G., Chagnon, G., et al. 2002, ApJ, 579, 446 [NASA ADS] [CrossRef] [Google Scholar]
- Perrin, G., Ridgway, S. T., Mennesson, B., et al. 2004, A&A, 426, 279 [NASA ADS] [CrossRef] [EDP Sciences] [Google Scholar]
- Petrov, R. G., Malbet, F., Weigelt, G., et al. 2007, A&A, 464, 1 [NASA ADS] [CrossRef] [EDP Sciences] [Google Scholar]
- Pluzhnik, E. A., Ragland, S., Le Coroller, H., et al. 2009, ApJ, 700, 114 [NASA ADS] [CrossRef] [Google Scholar]
- Ragland, S., Traub, W. A., Berger, J.-P., et al. 2006, ApJ, 652, 650 [NASA ADS] [CrossRef] [Google Scholar]
- Ragland, S., Le Coroller, H., Pluzhnik, E., et al. 2008, ApJ, 679, 746 [NASA ADS] [CrossRef] [Google Scholar]
- Samus, N. N., Durlevich, O. V., et al. 2009, VizieR Online Data Catalog, 1, 2025 [Google Scholar]
- Smith, B., Leisawitz, D., Castelaz, M., & Luttermoser, D. 2002, AJ, 123, 948 [NASA ADS] [CrossRef] [Google Scholar]
- Tatulli, E., Millour, F., Chelli, A., et al. 2007, A&A, 464, 29 [NASA ADS] [CrossRef] [EDP Sciences] [Google Scholar]
- Whitelock, P. A., Feast, M. W., & van Leeuwen, F. 2008, MNRAS, 386, 313 [NASA ADS] [CrossRef] [Google Scholar]
- Wittkowski, M., Boboltz, D. A., Driebe, T., et al. 2008, A&A, 479, L21 [NASA ADS] [CrossRef] [EDP Sciences] [Google Scholar]
All Tables
All Figures
|
Fig. 1 R Cnc flux, squared visibility amplitude, closure phase, and UD diameter (from top to bottom) as a function of wavelength. Data of the remaining three targets are shown in Fig. 2 of the electronic version. The wavelength range is 1.92–2.47 μm (MR21 mode: 1.92–2.26 μm, MR23 mode: range 2.12–2.47 μm). The modes overlap in the region 2.12–2.26 μm, where the two lines appear as one thicker line. The thick vertical lines denote the errors averaged over three wavelength intervals. The blue lines show a comparison to the best fitting model of the P/M model atmosphere series (Ireland et al. 2004a,b), and the red lines the best fitting model of the new CODEX series (Ireland et al. 2008; 2011). The dashed line shows a uniform disk curve fitted to the 2.25 μm near-continuum bandpass. |
| In the text | |
|
Fig. 2 Flux, squared visibility amplitude, closure phase, and uniform disk diameter (from top to bottom) as a function of wavelength for the Mira variables X Hya, W Vel, and RW Vel (from left to right). As Fig. 1, but for the remaining targets of our sample. |
| In the text | |
Current usage metrics show cumulative count of Article Views (full-text article views including HTML views, PDF and ePub downloads, according to the available data) and Abstracts Views on Vision4Press platform.
Data correspond to usage on the plateform after 2015. The current usage metrics is available 48-96 hours after online publication and is updated daily on week days.
Initial download of the metrics may take a while.