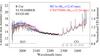
Fig. 1
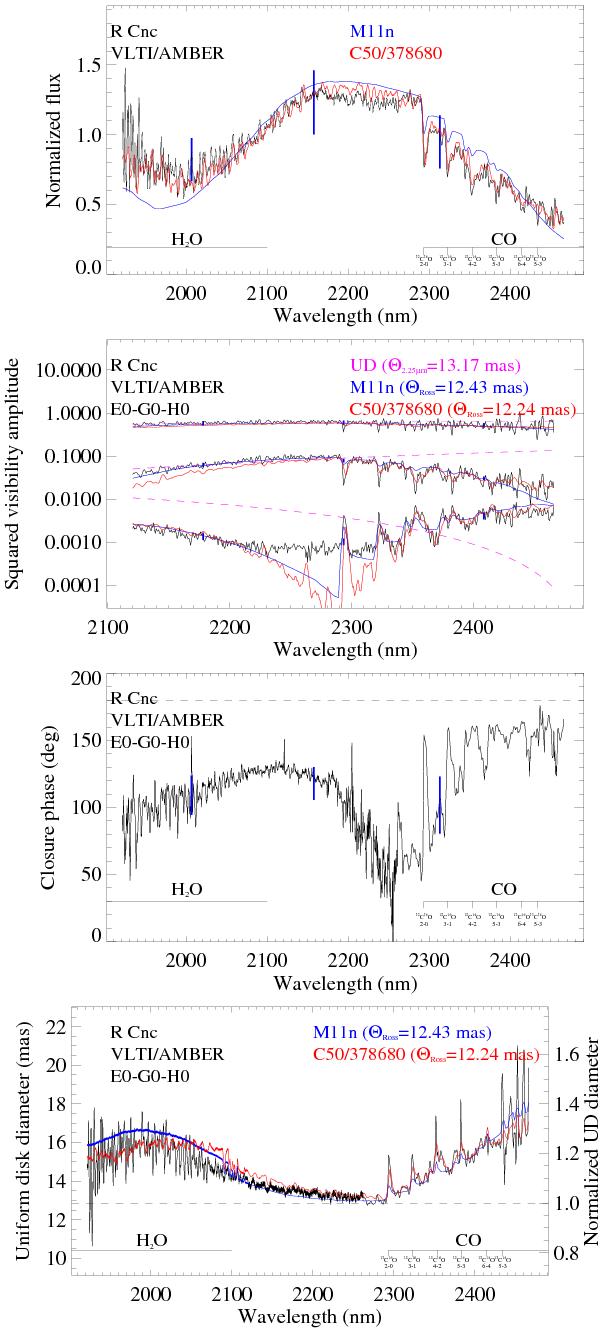
R Cnc flux, squared visibility amplitude, closure phase, and UD diameter (from top to bottom) as a function of wavelength. Data of the remaining three targets are shown in Fig. 2 of the electronic version. The wavelength range is 1.92–2.47 μm (MR21 mode: 1.92–2.26 μm, MR23 mode: range 2.12–2.47 μm). The modes overlap in the region 2.12–2.26 μm, where the two lines appear as one thicker line. The thick vertical lines denote the errors averaged over three wavelength intervals. The blue lines show a comparison to the best fitting model of the P/M model atmosphere series (Ireland et al. 2004a,b), and the red lines the best fitting model of the new CODEX series (Ireland et al. 2008; 2011). The dashed line shows a uniform disk curve fitted to the 2.25 μm near-continuum bandpass.
Current usage metrics show cumulative count of Article Views (full-text article views including HTML views, PDF and ePub downloads, according to the available data) and Abstracts Views on Vision4Press platform.
Data correspond to usage on the plateform after 2015. The current usage metrics is available 48-96 hours after online publication and is updated daily on week days.
Initial download of the metrics may take a while.