| Issue |
A&A
Volume 532, August 2011
|
|
|---|---|---|
| Article Number | A9 | |
| Number of page(s) | 13 | |
| Section | Interstellar and circumstellar matter | |
| DOI | https://doi.org/10.1051/0004-6361/201015924 | |
| Published online | 12 July 2011 | |
The structure and kinematics of the ISM around HD 192281
1
Instituto Argentino de Radioastronomía (CCT-La Plata, CONICET), CC No. 5, 1894 Villa Elisa, Argentina
e-mail: arnal@iar.unlp.edu.ar
2
Facultad de Ciencias Astronómicas y Geofísicas, Universidad Nacional de La Plata, Paseo del Bosque s/n, 1900 La Plata, Argentina
3
Instituto de Astronomía y Física del Espacio, CC No. 67, Ciudad Autónoma de Buenos Aires, Argentina
4 Département de physique, de génie physique et d’optique et Centre de recherche en astrophysique du Québec (CRAQ), Université Laval, Québec (Qué), G1V 0A6, Canada
Received: 13 October 2010
Accepted: 3 March 2011
Aims. This work aims at investigating the interaction of HD 192281 (O5 Vn((f))p) with its local ISM. The purpose is to analyse the effects that a massive star has on the structure and kinematics of its surrounding gas.
Methods. To carry out this study, we used high-resolution radio continuum and 21-cm H i line data from the Canadian Galactic Plane Survey (CGPS). This data base was complemented with radio continuum, infrared, and molecular data retrieved from available surveys. Given that HD 192281 is very likely a runaway star, we attempt to establish whether the observed H i distribution can be interpreted in terms of a simple bow shock model.
Results. Analysis of the H i data shows the presence of an H i feature likely to be associated with HD 192281. This feature remains detectable from ~5 to –10 km s-1. At the most negative radial velocities, the shape of the H i feature is highly reminiscent of a bow shock structure seen projected onto the plane of the sky. This feature has counterparts at radio-continuum, infrared, and CO emissions. The analysis of the radio continuum data suggests a thermal spectrum for the gas related to this structure.
Key words: stars: individual: HD 192281 / stars: mass-loss / stars: winds, outflows / ISM: bubbles / ISM: structure
© ESO, 2011
1. Introduction
Over their lifetimes, O-stars have a substantial impact on their local interstellar medium (ISM) through their high Lyman continuum flux, their strong stellar wind, and their eventual disruption as supernova. A subclass of these stars, known as Of stars, contain broad and strong emission lines in their optical spectrum mainly because of the He ii (λ4686 Å), N iii (λλ 4634, 4640, 4641 Å), and forbidden lines, along with normal absorption lines. These lines frequently show P-Cygni profiles that are indicative of high-mass loss rate. According to Eenens & Williams (1994) and Chlebowski & Garmany (1991), the mass loss rate ()Ṁ and wind terminal velocity (v∞) of Of stars range from 10-7 to 10-5 M⊙ yr-1 and from 2000 to 3000 km s-1, respectively. A total of 108 Of stars are known to exist in the Galaxy, and almost half of them are associated with optical nebulae (Lozinskaya 1992).
Since massive stars having a main sequence mass above 10 M⊙ radiate a copious rain of ionizing photons into their local ISM (1.8 × 1048 ≤ NLyc ≤ 7.1 × 1049 s-1, Martins et al. 2005), and inject into it a great deal of mechanical energy via their powerful stellar winds (Lw = 0.5 × [Ṁentity!#xa0!] ), they have the basic ingredients for profoundly affecting the structure and dynamics of the ISM. Based on the early works of Avedisova (1972) and Weaver et al. (1977), it was soon realized that massive stars can create what is known as an interstellar bubble (IB)in their surrounding ISM. This is a region of very low density (n ~ 10-2 to 10-3 cm-3) and high temperature (T ~ 106 − 7 K), which is surrounded by an expanding shell of gas that may be detectable as an expanding H i shell after cooling down. In the ideal case where the star is at rest with respect to its surroundings and the ISM is homogeneous, theoretical models predict a spherically symmetric IB with the massive star located at its centre. On the other hand, in those cases where the stellar peculiar velocity is high enough (vpec ≥ 30 km s-1), the spherically symmetric geometry will be distorted, and a bow-shock geometry, with the high-velocity star located close to its apex, will be observed. Observationally, most of the high-mass stars have low peculiar spatial velocities, and when observed in the λ ~ 21-cm line radiation, the star is usually seen projected onto, or close to, a minimum in the H i emissivity. Furthermore, since dust particles are mixed with gaseous matter they may emit in the far infrared, after being heated up by the stellar radiation. Therefore, MSX and IRAS databases are also well suited to these studies.
Most of the earlier H i studies toward O-stars (see Cappa & Herbstmeier 2000, and references there in) were carried out using single-dish instruments having an angular resolution in the range from ~9′ to 30′. These studies show that most of the stars appear projected towards regions of the sky having a low neutral hydrogen emissivity when compared to their surroundings. The shape of these low emission regions varies from almost spherical to highly elliptical, and can only be observed in a limited range of radial velocity.
The situation for radio observations, reviewed by Cappa et al. (2003), has now evolved considerably with the advent of large galactic surveys, namely the Canadian Galactic Plane Survey (CGPS, Taylor et al. 2003), the Southern GPS (SGPS, McClure-Griffiths et al. 2005; Haverkorn et al. 2006), and the VLA GPS (VGPS, Stil et al. 2006). These surveys now make it possible to identify and study the structure and dynamics of the ISM at ~1 arcmin resolution.
We have undertaken a project aimed at systematically studying the immediate vicinity of a number of stars expected to be major contributors in shaping the ISM (Cappa et al. 2002; Cichowolski et al. 2003; Pineault et al. 2008). To minimize confusion, we selected objects with relatively high galactic latitudes. In this paper, we analyse the environs of the Of star HD 192281. This star, which is a member of the OB-association Cyg OB8, is located at (l, b) = (77 12, +340), has spectral type O5 Vn((f))p (Walborn 1972), and is a fast rotator with V sini = 270 km s-1 (Conti & Ebbets 1977). Distance determinations for this star vary between 1.55 kpc (Stone 1978) and 2.4 kpc (Humphreys 1978).
The kinematics of this star is a matter of some debate. On one hand, based on a comparison between the observed radial velocity, Vr ≃ − 48 km s-1 and the radial component of the circular velocity that would correspond to the actual location of the star within the Galaxy, Cruz-González et al. (1974) derived a peculiar radial velocity of –55 km s-1 and list this star as a “probable runaway”. On the other hand, Gies & Bolton (1986) (GB) cast some doubts on this interpretation based on evidence of a Balmer line velocity progression in the optical spectrum of HD192281. They claim that the radial velocity derived from the He II line λ4686, − 27.1 km s-1, is probably closer to the physical velocity of the star, because this line is formed deeper in the stellar atmosphere, where the wind velocity is lower. Based on this, GB concluded that HD 192281 is unlikely to be a runaway star. Barannikov (1993) performed a radial velocity variability analysis of this star, and claim to find radial velocity variations with a semi-amplitude of 16.1 ± 2.4 km s-1 on a 5.48 day period. He further argues that this small amplitude is compatible with the presence of a low-mass companion star and derived a system’s baricentric radial velocity of −40.4 ± 2.7 km s-1. These results should be viewed with caution, since Barannikov’s claims rely on measurements of the strongest absorption lines of the Balmer series (H9, H8, Hδ, Hγ, and Hβ) and He I λ 4026 and He II λλ 4200, 4562 and 4686 lines. De Becker & Rauw (2004) carried out a detailed radial velocity analysis of the He II λ4541 absorption line, which forms deeper inside the stellar photosphere, and derived a mean radial velocity of − 23.1 ± 8 km s-1. They find no evidence in favour of a radial velocity variability as claimed by Barannikov. In this paper all radial velocities are referred to the local standard of rest.
Main parameters of the datasets.
Proper motion measurements for HD 192281 are available from several catalogues. Hipparcos (ESA 1997) quotes (μαcosδ, μδ) = (−7.76 ± 0.53, −2.54 ± 0.56) mas yr-1, the Tycho-2 Catalogue (Hog et al. 2000) lists (μαcosδ, μδ) = (−7.9 ± 1.0, −1.8 ± 1.1) mas yr-1, while the Third US Naval Observatory CCD Astrograph Catalog (UCAC3) gives (μαcosδ, μδ) = (−8.0 ± 0.7, −2.0 ± 0.8) mas yr-1. Since all proper motion measurements are, within errors, compatible with each other, in this paper we shall adopt those given by Hipparcos. Moffat et al. (1998) claimed that this star has significant peculiar proper motions, supporting a possible runaway nature for this star.
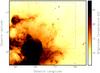 |
Fig. 1 Large-scale CGPS 1420 MHz continuum emission towards HD 192281 and its surroundings. The stellar position is indicated by an asterisk. The square shows the region covered by the other figures of this paper. The strong continuum source located in the lower left corner of this figure corresponds to the Galactic supernova remnant G78.2+2.1. |
2. Observational data
This research was carried out using a number of surveys and databases (see Table 1) publicly available, namely:
-
a)
The CGPS. It is a high-resolution (~1 arcmin) H i line and 408 and 1420 MHz radio continuum survey of the Galactic plane obtained with the Synthesis Telescope (Landecker et al. 2000) of the Dominion Radio Astrophysical Observatory (DRAO). It provides a unique opportunity to carry out an unbiased homogeneous study of the ISM structures and dynamics associated with massive stars and their evolved descendants. Before assembly into a mosaic, the data for the individual fields are carefully processed to remove artifacts and to obtain the highest possible dynamic range, using the routines described by Willis (1999). Accurate representation of all structures on the largest scales is assured by incorporating data from large single antennas with data from the Synthesis Telescope, after suitable filtering in the Fourier domain. Continuum data are derived from the 1.4 GHz Effelsberg survey (Reich et al. 1997) and the 408 MHz All-Sky Survey by Haslam (1985). Single antenna H i data are obtained from a survey of the CGPS region made with the DRAO 26-m Telescope (Higgs & Tapping 2000).
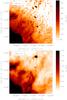
Fig. 2 Radio continuum emission towards HD 192281. The upper and lower panels show the emission at 408 and 2695 MHz, respectively. The position of HD 192281 is marked by a star symbol. The white dashed contours shown in the lower panel mark the location of those areas used to measure the continuum flux density.
The CGPS database also comprises IRAS high-resolution (HIRES) images (Fowler & Aumann 1994; Cao et al. 1997) produced at the Infrared Processing and Analysis Center (IPAC)1. The image is the result of 20 iterations of the algorithm, giving an approximate resolution of 1′−2′.
-
b)
Additional radio continuum surveys carried out at 2695 MHz (Fürst et al. 1990), 8350 MHz, and 14350 MHz (Langston et al. 2000).
-
c)
Infrared data retrieved from the Midcourse Space Experiment (MSX2) (Price et al. 2001).
-
d)
Carbon monoxide data (J = 1 → 0) retrieved from the survey carried out by Dame et al. (1987).
3. Results
3.1. Radio continuum emission
Figure 1 is a 1420 MHz CGPS continuum image showing the large-scale structure of the ISM in the general direction to HD 192281 [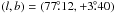 ]. The strong and almost circular feature seen in the lower left part of the image is the well-known shell-type supernova remnant G78.2+2.1 (≡ DR4, γ Cygni), recently thoroughly studied by Ladouceur & Pineault (2008). A large number of point sources, most of them extragalactic in nature, are evident at high galactic latitudes. The high dynamic range of the CGPS data allows the detection of weak emission features present in the immediate surroundings of G78.2+2.1. In particular, between G78.2+2.1 and the position of HD 192281 there is evidence of two weak continuum features. Figure 2 shows that these features are detectable at 408 MHz, and become better defined at 2695 MHz. At this frequency the continuum emission in the neighborhood of HD 192281 has the appearance of an incomplete shell-like feature with the star close to its highest latitude extreme. Ladouceur & Pineault (2008) suggested that this faint shell could have resulted from a breakout of the SNR blast wave into a medium of lower density.
3.2. Extended infrared emission
The large shell-like structure observed in the radio continuum emission distribution is also easily recognizable at infrared wavelengths. The MSX at 8.3 μm along with the 12, 60, and 100 μm HIRES images, are shown in Fig. 3. At IR wavelengths, an incomplete ring-like structure similar to that observed at 2695 MHz is observed.
In the immediate vicinity of HD 192281 the IR emission shows a small ring-like feature of about 17′ in size centred near the stellar position. This small structure is clearly identified in MSX at 8.3 μm emission (see the upper left image of Fig. 3) and in the four IRAS bands. The star lies near the border of the cavity in all IRAS bands. Though at first glance one may be tempted to physically relate the IR feature to the star, it is worth stressing that the large-scale IR emission is highly filamentary, and that several small IR structures similar to the one just described are easily recognizable towards different regions (see for example those features centred at 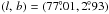 and
and  of the large-scale IR shell-like feature. Therefore, the presence of a small ring of IR emission seen projected onto HD 192281 may well be a chance coincidence between the star and one of the many small scale IR features that constitute the extended IR emission.
3.3. Neutral hydrogen line emission
The neutral hydrogen emission spans the velocity range from − 130 to +30 km s-1 along l ≃ 77°. To increase the signal-to-noise (S/N) ratio, the original line channel maps were spatially convolved to yield a Gaussian beam response of FWHM = 3′. In this way, the final rms noise level, in units of brightness temperature, in a single line channel map is ΔTrms ~ 0.4 K. To help us distinguish between H i minima possibly associated with HD 192281 from those arising from the normal structure of the ISM, the following criteria were adopted.
-
i)
The O star should appear projected onto, or close to, a region of depressed H i emissivity.
-
ii)
The region mentioned in i) should remain observable throughout a significant number of individual and consecutive line channel maps. In our case we have set this number to five.
-
iii)
The kinematical distance derived, using existing rotation curves of the Milky Way (i.e. Fich et al. 1989), from the mean radial velocity of the H i minimum should not be in conflict with the accepted distance range for the star.
Given that along the galactic longitude l ~ 77° the velocity gradient is small, about 6.5 km s-1 kpc-1, making the task of determining a “reliable” kinematic distance particularly difficult, in the case of HD 192281 the last criterion has a low weight. In addition one should bear in mind that significant non-circular motions are known to exist in this part of the Galaxy.
Considering the criteria just mentioned, the entire (l, b, v) H i data cube was inspected for features likely to be related to HD 192281. In Fig. 4 three averaged line channel maps spanning the velocity range from +15.0 to − 30.3 km s-1 are shown. To facilitate the recognition of features that may arise from the action of the O-star onto its local ISM, a constant mean brightness temperature value was subtracted from every channel map. This mean level is obtained by averaging the brightness temperature over the full field of view of each line channel map. Every image is an average of eighteen individual line channel maps, has an rms noise of about ΔTrms ~ 0.1 K, and covers a velocity interval of about 15 km s-1. In those images shown in Figs. 4a and c, the H i emission distribution displays a lot of small angular scale structures superimposed on a brightness temperature gradient characteristic of the overall galactic H i emission in this part of the Milky Way. On the other hand, within the velocity interval +0.2 to − 14.65 km s-1 (Fig. 4b), the H i distribution drastically departs from the one described above. The dominant feature is now a hollow structure of H i emission protruding from an otherwise normal galactic emission. HD 192281 is observed projected onto the high-latitude border of this structure. It is worth mentioning that, although the entire velocity range spanned by the galactic H i emission was searched for H i features likely to be related to HD 192281, no peculiar structure besides the one shown in Fig. 4b was found.
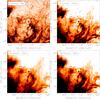 |
Fig. 3 Extended IR emission towards HD 192281 at 8.3 μm (upper left panel), 12.12 μm (upper right panel), 60 μm (lower left panel), and 100 μm (lower right panel). The position of HD 192281 is depicted by a star symbol. In the upper left image, the circumference centred at the stellar location marks the extension of the small ring-like structure referred to in Sect. 3.2. |
To better define the spatial structure and velocity behaviour of the H i gas in this velocity range, a mosaic of twelve averaged line channel maps spanning the velocity range from +5.13 km s-1 to − 22.08 km s-1 are depicted in Fig. 5. Each image covers a velocity range of ~ 2.5 km s-1 and has an rms noise of ΔTrms ~ 0.3 K.
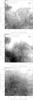 |
Fig. 4 H i brightness temperature images for selected velocity ranges. The velocity range covered by each map is given in its upper left corner and the displayed temperatures are a mean over the entire velocity width. The lowest temperature contour is − 15 K and the contour spacing is 5 K. A constant mean brightness temperature value was subtracted from each image (see text). The stellar location is indicated by a star symbol. The white dashed-line circumference drawn in the middle panel marks the position of the Hi hollow feature described in Sect. 3.3. |
The image of the H i distribution at +5.13 km s-1 shows HD 192281 projected onto a large region of low emissivity. From a morphological point of view, HD 192281 appears close to the northermost tip of a curved H i feature that can be traced from  up to
up to  ). A second arc-like feature begins to be noticeable at 0.19 km s-1 at
  . At more negative velocities, from –7.23 to –14.66 km s-1, this feature becomes more prominent and beyond –17.13 km s-1 it loses its identity and fades away.
3.4. Carbon monoxide emission
To investigate the presence of CO gas associated with HD 192281, the distribution of the carbon monoxide (CO ) J = 1 → 0 emission was analysed in the velocity range from –140 to +80 km s-1. In the velocity range from –11.1 km s-1 to –16.3, the bulk of the molecular emission arises from an elongated feature (Fig. 6, lower panel) that reaches its maximum temperature at (l,b) = (771, +36). This feature is labelled B. The major axis of this concentration runs almost parallel to the galactic plane. HD 192281 is seen projected towards a small indentation of the outer border of the molecular structure facing the Galactic plane. A second and weaker CO feature (Feature A) is observed in the same figure at (l,b) = (776, +34). This feature has a counterpart at continuum and infrared wavelengths. The velocity range where this structure is best detected ranges from − 15.0 to − 17.6 km s-1.
Within the velocity range from +5.9 to +0.7 km s-1 (see Fig. 6, upper panel), the CO distribution is quite different from the previous one. Most of the emission comes from a broad and slightly curved structure (Features D and E) that extends from 20 ≤ b ≤ 35 and 766 ≤ l ≤ 768. The latter and the CO feature peaking at (l,b) = (777, +25) (Feature C) have a spatial distribution that is highly reminiscent of the incomplete shell-like features observed at IR and radio continuum wavelengths.
4. Discussion
4.1. Nature of the radio continuum emission
To help shed some light on the nature of the shell-like structure observed in the radio continuum emission, its flux density was measured at different frequencies. To estimate the flux density of this source, a background contribution from unrelated gas has to be accounted for. To this end a twisted plane was fitted at every frequency through regions located close enough to, but outside of, the shell-like feature (see Fig. 2). Admittedly the background removal has two main drawbacks that relate to: i) the extended nature of the source, and ii) the angular proximity to the SNR G78.2+2.1. Indeed the continuum source we are interested in is seen projected onto a region with a steep brightness temperature gradient that strongly depends on position.
The measured continuum fluxes are given in Table 2. The large errors mainly reflect the uncertainties due to the background removal procedure. The resulting radio spectrum is given in Fig. 7. The best least square fit to these values (Fig. 7) provides a spectral index of α = −0.11 ± 0.02, a value fully compatible with optically thin, thermal, free-free emission. This spectral index rules out the suggestion made by Ladouceur & Pineault (2008) that this shell may be a breakout of the SNR G78.2+2.1 into a medium of lower density.
4.2. Physical parameters of the H ii region
To infer the properties of the radio continuum emitting region, the formulae from Mezger & Henderson (1967) for a pure hydrogen plasma were used. The estimate of the physical parameters relies upon assumptions concerning the geometry of the source. In this case, we assume that the ionized gas is distributed in an incomplete sphere, which lacks a spherical polar cap whose opening angle, as measured from the centre of the ionized gas distribution is 48°. As can be observed from Fig. 2, the interior of the assumed spherical distribution has lower continuum emission, indicating that the sphere is hollow. Thus, the geometry of the source can be best defined by assuming that the ionized gas is present in two concentric spherical shells whose thickness varies between 0.47 and 0.67 of their outer radius. Taking the assumed geometry into account, we use the spherical model proposed by Mezger & Henderson (1967) considering a filling factor of about f = 0.8.
Measured continuum flux densities.
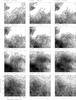 |
Fig. 5 H i brightness temperature images for selected velocity ranges. The velocity range covered by each map is 2.47 km s-1, and the displayed temperatures are a mean over the entire velocity map velocity width. The central velocity of each image is given in the upper left corner. The beam size is shown as a circle in the upper right corner of the entire figure. A constant mean brightness temperature value was subtracted from each image (see text). The lowest temperature contour is − 21 K and the contour spacing is 7 K. |
After adopting the galactic disk temperature gradient found by Quireza et al. (2006), an electron temperature of 8160 ± 530 K is found. The electron density (ne), and the ionized mass (MHII) can be obtained using simple geometric models of HII regions (Schraml & Mezger 1969). Using their spherical model and the volume filling factor quoted above, we derived an electron density of ne = 7.3 ± 0.8 cm-3 and a total mass of ionized gas of MHII = 1300 ± 650 M⊙. The total number of Lyman continuum photons needed to keep the region ionized is given by 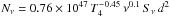 (Chaisson 1976), where Te is the electron temperature in units of 104 K, d the distance in kpc, ν the frequency in units of GHz, and Sν the measured total flux density in units of Jy. We obtained Nν = (3.6 ± 1.5) × 1048 s-1. The uncertainties quoted for ne, MHII, and Nν are derived under the assumption of a distance error of about 0.3 kpc, an electron temperature uncertainty of 530 K and the flux density error quoted in Table 2. The number of ionizing photons derived in this way is a lower limit to the total number of Lyman continuum photons emitted by the star, since a fraction of them may be absorbed by dust present inside the HII region. After being heated, the dust grains emit at infrared wavelengths. The number of Lyman continuum photons needed to power the H ii region, could well be provided by HD 192281, since this number is a small fraction of the total UV ionizing photons emitted by an O5 V star (~1.8 × 1049 s-1) like HD 192281 (Martins et al. 2005).
4.3. Dust parameters
The large-scale IR emission distribution at four different wavelengths is shown in Fig. 3. At all frequencies, emission arising from an incomplete shell-like feature is observed. This IR feature is highly reminiscent of the one observed at radio continuum frequencies. At IR wavelengths HD 192281 is also observed towards a region of low IR emissivity that is close to the northern extreme of the shell-like distribution. After removing the background emission, the infrared flux densities were determined for all MSX and HIRES bands. The fluxes were derived by integrating over different polygons surrounding the source. The measured flux densities are given in Table 3.
It has been empirically found that the submillimetre spectrum of a cool dust cloud can be fitted by the product of the black-body intensity, Bν (Td), and a grain emissivity that varies as νm, where m increases from ~ 1 at λ ≤ 200 μm to ≥ 2 at longer wavelengths (λ ~ 1000 μm) (Schwartz 1982). The dust temperature derived from the fit to the measured 60 and 100 μm data of a function of the form νm × Bν(Td), adopting m = 1.5, is of the order of Td ≃ 24 ± 4 K. The error quoted for Td stems from the uncertainty in the definition of the background zero level, and assuming that the fluxes at 60 and 100 μm are accurate to within 21% and 32%, respectively (Fich & Terebey 1996). The derived dust temperature is typical of H ii regions (e.g. Fich & Terebey 1996).
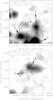 |
Fig. 6 CO emission distribution in the velocity range from +5.9 to +0.7 km s-1 (upper panel) and from –11.1 to –16.3 km s-1 (lower panel). Contour levels correspond to 0.7, 1.2, 1.7, 2.2, 2.7, 3.7, 4.7, 5.7, and 6.7 K. The location of HD 192281 is indicated by a star symbol. The main CO concentrations are labelled A, B, C, D, and E. The angular resolution is indicated in the top right corner of the upper panel. |
The IR luminosity in the 7−135 μm band can be calculated using the equations (Tokunaga 2000)  (1)where d is the distance in pc and FIR is the measured flux density given by
  (2)where Fi is the measured flux density in band i and a, b, c, d, and e are constants whose values are 1.0 × 10⁻¹⁴, 20.653, 7.538, 4.578 and 1.762, respectively. Based only on the flux density errors quoted in Table 3, which only reflect measurement errors, the FIR determination is accurate to within 6%. Under the assumption that the HIRES fluxes are correctly calibrated, the LIR estimate, LIR ~ 8.8 × 10⁴ L⊙ is accurate to within ~40%. The dust mass can be estimated from the measured 100 μm flux, using
  (3)where F100 is the flux density at 100 μm in Jy, d the distance in pc, and Td the dust temperature in K. A mass absorption coefficient per unit length of 2.5 m2 kg-1 at 100 μm is assumed. The dust mass turns out to be 130 ± 35 M⊙. The dust mass uncertainty is derived based on the uncertainties quoted for F100, Td, and d.
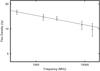 |
Fig. 7 Radio spectrum of the shell like feature observed in the neighborhood of HD 192281. Three σ error bars are depicted along the measured flux density. The dashed line represents the flux density for an optically thin plasma having a flux density spectral index of α = −0.11. |
4.4. Carbon monoxide data
The main physical characteristics of the different CO concentrations are summarized in Table 4.
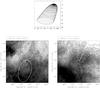 |
Fig. 8 H i temperature brightness emission distribution from +3.5 to –4.8 km s-1 (lower left panel) and from –5.6 to –14.7 km s-1 (lower right panel). The stellar position is marked by a star symbol. A constant mean brightness temperature value was subtracted from each image (see text). The direction of the nominal peculiar stellar proper motion is shown by a solid arrow, while ± 1σ directions are shown by dashed arrows (lower right panel). In both lower panels the outer border of the bow shock is indicated by a dashed curve. In the lower left panel the ellipse depicts the bow shock cross section at a distance of 1 pc downstream from the stellar position. The upper panel shows the 3D bow shock structure orientation as it would appear to an external observer (see text). The star is located at the (0, 0) position. |
Mid and far-infrared flux density measurements.
The positions quoted for the concentrations correspond to the CO peak, and the LSR velocity, VLSR, is the velocity corresponding to the maximum CO temperature of that concentration. The line width at half maximum, ΔV, was derived by fitting a Gaussian to the observed averaged profile. The linear dimensions were derived from a two-dimensional Gaussian fitting. The position angle (PA) of the concentration’s major axis is measured counterclockwise from north. To estimate the mass, we used the empirical relationship between molecular hydrogen column density, N(H2), and integrated CO intensity, W(12CO),  (4)where W(12CO) is given in units of K km s-1(Magnani & Onello 1995). The total mass of each concentration was estimated by using
  (5)where d is the distance of the concentration, Ω is the solid angle subtended by the concentration, mH is the proton mass, and μ is the mean molecular weight per H2 molecule. Assuming a relative helium abundance per mass of 25%, μ turns out to be μ = 2.8. A volume density, n(H2), was derived under the assumption that the total mass M is distributed in a spherical volume of radius
  , where L and l are the major and minor axes, respectively, of the observed angular distribution. These quantities were corrected for beam broadening.
Main physical parameters of the CO structures
4.5. Neutral hydrogen data
Taking the structures described in Sect. 3.3 into account, mean brightness temperature images spanning the velocity range from +3.5 to − 4.8 km s-1 and from −5.6 to −14.7 km s-1were constructed (Fig. 8). HD 192281, whose position is marked in both panels, is seen projected onto the outer part of the northern extreme of a semi-spherical feature (Fig. 8, left panel), and appears projected onto the interior of an H i elliptic feature (Fig. 8, right panel).
In the velocity range from − 5.6 to − 14.7 km s-1, both the spatial H i distribution and the position of HD 192281 fullfill the first two criteria put forward in Sect. 3.3. On the other hand, strictly speaking, the negative value of the radial velocity of the H i minimum rules out any possible physical relationship between the H i gas and the star because the distance corresponding to an H i structure having a radial velocity of − 10 km s-1 would be 5.6 ± 1.0 kpc, while distance estimates for HD 192281 vary between 1.55 and 2.4 kpc. However, as mentioned before, in this part of the Galaxy a straightforward interpretation of kinematic distances should be treated with caution. Along the line of sight towards HD 192281 kinematic distances are unreliable due to both the small velocity gradient predicted by galactic rotation models and the presence of streaming motions (Burton 1974).
In this context, it is worth mentioning that Hron (1987) lists four open clusters (see his Table 1a) in the galactic longitude range 75° ≤ l ≤ 79°, which have mean radial velocities in the range from − 13 to +4 km s-1, even though their photometric distances fall between 1.02 and 1.86 kpc. He claims that these clusters have radial velocities and distances accurate to 4 km s-1 and 20%, respectively. The galactic velocity field of Fich et al. (1989) would place these clusters at kinematic distances ranging from 3.9 kpc to 6.0 kpc. Thus, it would be safe to conclude that along l ~ 77° a negative radial velocity does not necessarily imply a long distance from the Sun.
Bearing in mind that an early O-type star is expected to stir up its surrounding ISM, and since throughout the entire H i data cube we could not find another region of low neutral hydrogen emissivity close enough to HD 192281, we believe that the H i structures shown in Fig. 8 are the result of the interaction of HD 192281 with its surroundings.
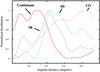 |
Fig. 9 Radial distribution of the continuum emission at 2695 MHz (red line), 60 μm (blue line), H i (green line), and CO emission (magenta line) as a function of the angular distance from ( |

4.6. Relationship among different structures
Morphological evidence in favour of a physical association between the ridge of CO (see Fig. 6, upper panel), the H i emission (see Fig. 8, left panel), the continuum emission, and the IR can be seen from a comparison of their distribution as a function of angular distance (Fig. 9) from the geometric centre, (l, b) = (773, +30) of the H i feature. In Fig. 9 the different lines represent the mean value of the corresponding emission along concentric rings spaced by 1 5. The average was taken between position angles, measured counterclockwise from north, 2070 and 2980. The continuum, infrared, and H i images were first convolved to a common beam of 43. The normalized emission at a given frequency was computed by subtracting from each point the minimum value at that frequency [0.32 K (2695 MHz), 7.14 K (H i ), 85.8 MJy/sr (60 μm), and 0.03 K (CO )], and then dividing by the corresponding maximum [0.8 K (2695 MHz), 12.3 K (H i ), 101 MJy/sr (60 μm) and 0.95 K (CO )]. This comparison shows that the ionized gas depicts the innermost distribution, where the molecular gas is the outermost one with the infrared and atomic gas peaking between them. These results are consistent with what would be expected for an arc-like feature that is being heated, ionized, and dissociated from a central source.
In Fig. 6 (lower panel) it is shown that HD 192281 is seen projected onto a small indentation of the southern border of the CO feature labelled B. At first sight, the physical location and the mean radial velocity (− 13.4 km s-1) of the molecular concentration may speak in favour of a physical association between this molecular feature and the ovoid H i feature whose systemic velocity is ~−10 km s-1. If the observed angular distance between concentration B and HD 192281 were a consequence of a short physical distance between them, the molecular gas would be exposed to a very high flux of stellar ionizing photons. Therefore, the rain of energetic photons from HD 192281 would inevitably provoke dissociation of the molecular gas, ionization of the atomic gas, and heating of the dust particles. Owing to this, we would expect, in the immediate neighbourhood of HD 192281, to observe radio continuum emission (arising from the ionized gas), infrared emission (arising from the heated dust), and emission arising from polycyclic aromatic hydrocarbons (PAH). The latter absorb UV radiation and re-emit in various mid-infrared spectral features. The 8.3 μm MSX Band contains two of the strongest PAH features at 7.7 and 8.6 μm. For this reason, this band is an excellent tracer of a photodissociation region (PDR), which is the interface between atomic and molecular gas. Though a close examination of the databases used in this work shows no increment in the expected continuum emission in both the radio and the IR windows in the region of structure B facing the position of HD 192281, there seems to be a small feature close to the star in the MSX Band A that may be pinning down the location of a PDR in this molecular concentration.
In Fig. 10, projected onto the area covered by cloud B, we can see a weak arc of 8.3 μm emission and the IRAS point source IRAS20097+4005. This weak arc of emission is not seen at the other MSX bands. Based on this, we identify the 8.3 μm emission with a PDR created by HD 192281 within cloud B. Applying the criteria of Junkes et al. (1992, JFR) we find that IRAS20097+4005, which is seen projected onto the PDR, fullfills the requirements set by JFR to be considered a young stellar object (YSO) candidate . The observed morphology suggests that the expansion of the ionized region could have induced the formation of a new star in the neighbouring molecular envelope.
With the information at hand, and bearing in mind the lack of both radio continuum and IR emission already reported in IBs associated with other early type stars (Cichowolski & Arnal 2004), a physical association between the H i feature related to HD 192281 and concentration B cannot be excluded.
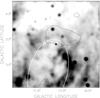 |
Fig. 10 MSX Band A (8.3 μm, gray scale) emission distribution convolved to a 3 arc min resolution. The solid contour indicates the location of the CO clouds labelled A and B (see Fig. 6). The star indicates the position of HD 192281, and the triangle marks the position of the YSO candidate IRAS 20097+4005. The ellipse depicts the cross section of the bow shock structure corresponding to z = 1 pc downstream the apex of the bow shock. |
4.7. A bow shock scenario
The different databases used in this investigation are consistent with a scenario where HD 192281 has strongly influenced its surrounding interstellar medium. In particular, the H i data show two structures at slightly different radial velocities. One of the structures has the appearance of a semi-circular feature (Fig. 8, left panel) while the other looks like an ellipsoid (Fig. 8, right panel). In this context, we wonder whether these findings could be supported by a bow shock model. The first relevant issue is whether HD 192281 can be considered a runaway star. By adopting a radial velocity of −23.1 ± 8 km s-1 (De Becker & Rauw 2004) and following the procedure outlined by van der Sluys & Lamers (2003) (after correcting the sign of the w⊙ term in their Eq. (19)) and Cichowolski et al. (2008), and by adopting a distance of 1.5 ± 0.3 kpc for HD 192281, the stellar peculiar velocity components are 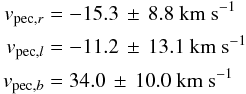 where vpec,r, is the peculiar radial velocity, vpec,l the peculiar velocity along galactic longitude, and vpec,b the peculiar velocity along galactic latitude. The corresponding total peculiar velocity of the star,
 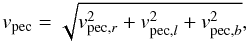 (6)is vpec = 39.0 ± 10.0 km s-1. Increasing the stellar distance to its maximum quoted value, namely 2.4 kpc, the total peculiar velocity increases to vpec = 55.0 ± 15.0 km s-1. Therefore, when adopting the criterion of Cruz-González et al. (1974), the spatial peculiar velocity of this star (either at 1.5 kpc or 2.4 kpc) implies that HD 192281 is very likely a runaway star.
According to van der Sluys & Lamers (2003) only two angles, labelled i and φ, are needed to completely define the spatial orientation with respect to the observer of the structure created by a star moving with respect to its ISM with a high peculiar velocity. The angle i is measured from the line of sight towards the observer (i = 90° corresponds to the plane of the sky), whilst φ is measured on the plane of the sky, counterclockwise from the tip of the peculiar velocity vector (see Fig. 4 of van der Sluys & Lamers 2003). Following van der Sluys & Lamers (2003), the above angles are defined as 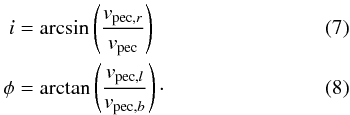 After adopting a stellar distance of 1.5 ± 0.3 kpc, the angles are i = 113° ± 11°, and φ = −18° ± 20°, while at the largest distance quoted for HD 192281, 2.4 kpc (Humphreys 1978), the angles i and φ are 105° ± 15°, and −18° ± 21°, respectively. Therefore, an increment in the distance has little effect on the overall orientation of the structure. The angles i and φ remain, within their errors, almost unchanged.
The shape of the structure formed by a fast-moving star has been the subject of several papers (Wilkin 1996; Raga et al. 1997). All of them indicate that such a star should create a bow shock structure whose symmetry axis should be aligned with the direction of motion of the star. To model this structure, we follow Wilkin (1996) by assuming a homogeneous interstellar medium with density ρ, and an isotropic stellar wind with constant mass-loss rate aṀnd terminal velocity v∞. The resulting structure should have a paraboloidal shape, with the stellar velocity vector as its symmetry axis, and a stand-off distance ro (i.e. the distance from the star along the symmetry axis where the momentum of the stellar wind and the ambient medium balance each other) given by 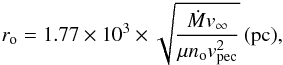 (9)where iṀs given in units of M⊙/yr, v∞ and vpec in km s-1, no in units of cm-3, and μ is the mean molecular weight. Since HD 192281 has no measured values of aṀnd v∞, we have adopted for this star those provided for HD 14434, a star with a similar spectral type (Chlebowski & Garmany 1991). Hence, =Ṁ 7 × 10⁻⁷ M⊙/yr, and v∞ = 2700 km s-1. Adopting μ = 1.3 for the H i we obtain 1.4
 . The lowest value of ro corresponds to the largest value of vpec (e.g. the highest distance for HD 192281). After error propagation, the relative error of ro is of the order of 27%.
Due to projection effects, the stand-off distance given by Eq. (9) is related to the observed stand-off distance (ro,p) by  (10)where the angles i and φ are those defined above. Adopting a stellar distance of 1.5 kpc, the projected angular distance between the star and the apex of the bow-shock would be
  . The quoted error stems from the errors in both angles. From Fig. 8 (right panel), a H i profile showing the variation with distance from HD 192281 of the H i mean brightness temperature was constructed by integrating the H i emission along concentric rings spaced by 72″. From this profile (not shown here) we derived an angular offset of (54 ± 12) between the star and the peak of the H i emission. This peak approximately pinpoints the position on the plane of the sky of the apex of the H i bow-shock structure, implying no ~ 0.4 ± 0.6 cm-3. This value of no is, within its large uncertainty, in reasonable agreement with the number density expected, no ~ 0.2 cm-3 (Lockman 1984), at the z distance of HD 192281 (z ~ 90 pc) from the galactic plane.
In the right panel of Fig. 8, it can be seen that the tangential peculiar motion of the star is oriented towards increasing latitude and decreasing longitude. From the radial and tangential peculiar velocities, the orientation of the bow shock structure with respect to the observed H i brightness temperature distribution is shown by the upper panel in Fig. 8.
It can be reasonably argued that the observed H i distribution shown in Fig. 8 (right panel) is consistent with a bow shock geometry. Furthermore, part of the arc-like feature seen in the H i distribution at more positive velocities (see Fig. 8, left panel) may be interpreted as belonging to the surface defining the bow shock downstream of the apex.
According to Wilkin (1996) the velocity of the gas moving downstream from the apex along the surface of the bow shock, also denominated tangential velocity, reaches, for low values of the ratio vpec/v∞ and large θ angles from the axis of symmetry, a value that is close to the stellar peculiar spatial velocity. The angle θ is a polar angle measured from the axis of symmetry of the bow shock, as seen by the star at the coordinate origin (the direction along θ = 0° points towards the head of the bow shock). In the case of HD 192281 this implies that the tangential velocity may reach a value as high as ~39 km s-1 (assuming the star is located at 1.5 kpc). Projection effects mean that the maximum radial velocity spread of any neutral gas associated with the bow shock would be ~34 km s-1. If our interpretation were correct, bearing in mind that HD 192281 is approaching the observer, the atomic gas on the surface of the bow shock would be detectable at radial velocities that are more positive than the radial velocity of the H i gas observed close to the apex. This is in good agreement with the observations. In this context, the large velocity interval covered by the H i gas likely to be related to the bow shock, from +3.5 to –14.7 km s-1, is easily accounted for.
Though the global morphology predicted by the bow shock model shows reasonable agreement with observational findings, there are differences between model predictions and the observations that cannot be explained. Indeed, under the assumption of a continuous mass loss from the star and a homogeneous ISM, we would expect to have a higher gas density close to the apex. Since this material with higher density should be located closer to the star than the material belonging to other parts of the bow shock, we would expect to have some relative bright radio continuum and infrared emissions outlining the interior of the bow shock in the apex and somewhat near the apex. Our observations do not show such features. In spite of these drawbacks, we are fairly confident that most of our observational findings towards the ISM around HD 192281 are in good agreement with and are explained well by a bow shock model.
5. Is HD 192281 associated with G78.2+2.1?
It is well known that, when the primary component of a massive binary system explodes as a supernova, the secondary may start moving with a spatial velocity comparable to its original orbital velocity (30 to 150 km s-1). This is one of the scenarios, the so-called binary-supernova scenario (or BSS for short), put forward to explain the origin of runaway stars (Burrows et al. 1995). HD 192281 has a spatial velocity compatible with a mild runaway nature, and the path of its proper motion when extrapolated backward in time passes close to the centre of the SNR G78.2+2.1. Since both objects appear to have comparable distances (~1.5 kpc), it may be worth exploring the possibility further that the origin of the high spatial velocity of HD 192281 is consequence of a BSS. The angular distance between the star and the SNR is ~17. The SNR age varies between 4000 to 7000 yr (Mavromatakis 2003). Therefore, to reach its present position with respect to the centre of G78.2+2.1, HD 192281 should have a proper motion between ~0 9 and ~15 per year. These figures are two orders of magnitude larger than the measured stellar proper motion. Therefore, it is highly unlikely that both objects are genetically linked to each other.
6. Conclusions
Based on CGPS radio continuum and H i line data, MSX and IRAS high-resolution infrared data, radio continuum data at higher frequencies, and low-resolution CO data, the interstellar medium in the environs of the massive star HD 192281 was analysed. The main findings of our study can be summarized as follows:
-
a)
The neutral hydrogen data show the presence of an elongated structure likely to be associated with HD 192281. The massive star is off-centred and located close to the high galactic latitude extreme of the H i feature. The atomic gas covers the velocity range from ~ +4 to ~ –15 km s-1.
-
b)
The H i feature has counterparts at both IR and radio continuum frequencies, and at molecular gas (CO) emission.
-
c)
The radio continuum emission is thermal (flux spectral index α = −0.11 ± 0.02), and HD 192281 is the likely source of ionization. The total mass of ionized gas is 1300 ± 650 M⊙, and the mean electron density is 7.3 ± 0.8 cm-3.
-
d)
The IR feature almost mimics the radio continuum emission. A dust temperature of 24 ± 4 K was derived using 60 and 100 μm HIRES data. The total luminosity of this feature in the range from 7 to 135 μm is (8.8 ± 3.5) 104 L⊙. The total dust mass involved in the IR emission amounts to 130 ± 35 M⊙.
-
e)
HD 192281 has a peculiar spatial velocity of 39.0 ± 10.0 km s-1, and can be classified as a mild run-away star. In this context most of the observational findings are explained well by a bow shock model.
-
f)
The interaction of the stellar wind of HD 192281 with the molecular cloud B may have induced star formation in the latter. In this context IRAS20097+4005 may be identified as a YSO candidate.
-
g)
Based on the measured proper motion for HD 192281 and the accepted age for the SNR G78.2+2.1, there is no way of physically linking both objects.
IPAC provides access to the MSX and IRAS images through the Infrared Science Archive at http://irsa.ipac.caltech.edu
Acknowledgments
This work was partially supported by the Agencia Nacional de Promoción Científica y Tecnológica (ANPCyT) under project PICT 14018/03 and 00812, by Consejo Nacional de Investigaciones Científicas y Técnicas CONICET under projects PIP 01299 and 02488, by Universidad Nacional de Buenos Aires (UBA) under project UBACyT X482, and by Universidad Nacional de La Plata (UNLP) under projects 11/G091 and 11/G093. The work of SP was supported by the Natural Sciences and Engineering Research Council of Canada (NSERC) and the Fonds FQRNT of Québec. The DRAO Synthesis Telescope is operated as a national facility by the National Research Council of Canada. The CGPS is a Canadian project with international partners and is supported by grants from NSERC. Data from the CGPS are publicly available through the facilities of the Canadian Astronomy Data Centre (http://cadc.hia.nrc.ca) operated by the Herzberg Institute of Astrophysics, NRC. SP thanks the Instituto Argentino de Radioastronomía, where part of this work was carried, for its hospitality.
References
- Avedisova, V. S. 1972, SvA, 15, 708 [Google Scholar]
- Barannikov, A. A. 1993, Astron. Lett., 19, 420 [NASA ADS] [Google Scholar]
- Burrows, A., Hayes, J., & Fryxell, B. A. 1995, ApJ, 450, 830 [NASA ADS] [CrossRef] [Google Scholar]
- Burton, W. B. 1974, in Galactic Radio Astronomy, ed. F. J. Kerr, & S. C. Simonson, IAU Symp., 60, 551 [Google Scholar]
- Cao, Y., Terebey, S., Prince, T. A., & Beichman, C. A. 1997, ApJS, 111, 387 [NASA ADS] [CrossRef] [Google Scholar]
- Cappa, C. E., & Herbstmeier, U. 2000, AJ, 120, 1963 [NASA ADS] [CrossRef] [Google Scholar]
- Cappa, C., Pineault, S., Arnal, E. M., & Cichowolski, S. 2002, A&A, 395, 955 [NASA ADS] [CrossRef] [EDP Sciences] [Google Scholar]
- Cappa, C. E., Arnal, E. M., Cichowolski, S., Goss, W. M., & Pineault, S. 2003, in A Massive Star Odyssey: From Main Sequence to Supernova, ed. K. van der Hucht, A. Herrero, & C. Esteban, IAU Symp., 212, 596 [Google Scholar]
- Chaisson, E. J. 1976, in Front. Astrophys., 259 [Google Scholar]
- Chlebowski, T., & Garmany, C. D. 1991, ApJ, 368, 241 [NASA ADS] [CrossRef] [Google Scholar]
- Cichowolski, S., & Arnal, E. M. 2004, A&A, 414, 203 [NASA ADS] [CrossRef] [EDP Sciences] [Google Scholar]
- Cichowolski, S., Arnal, E. M., Cappa, C. E., Pineault, S., & St-Louis, N. 2003, MNRAS, 343, 47 [NASA ADS] [CrossRef] [Google Scholar]
- Cichowolski, S., Pineault, S., Arnal, E. M., & Cappa, C. E. 2008, A&A, 478, 443 [NASA ADS] [CrossRef] [EDP Sciences] [Google Scholar]
- Conti, P. S., & Ebbets, D. 1977, ApJ, 213, 438 [NASA ADS] [CrossRef] [Google Scholar]
- Cruz-González, C., Recillas-Cruz, E., Costero, R., Peimbert, M., & Torres-Peimbert, S. 1974, Rev. Mex. Astron. Astrofis., 1, 211 [NASA ADS] [Google Scholar]
- Dame, T. M., Ungerechts, H., Cohen, R. S., et al. 1987, ApJ, 322, 706 [NASA ADS] [CrossRef] [Google Scholar]
- De Becker, M., & Rauw, G. 2004, A&A, 427, 995 [NASA ADS] [CrossRef] [EDP Sciences] [Google Scholar]
- Eenens, P. R. J., & Williams, P. M. 1994, MNRAS, 269, 1082 [NASA ADS] [Google Scholar]
- Fich, M., & Terebey, S. 1996, ApJ, 472, 624 [NASA ADS] [CrossRef] [Google Scholar]
- Fich, M., Blitz, L., & Stark, A. A. 1989, ApJ, 342, 272 [NASA ADS] [CrossRef] [Google Scholar]
- Fowler, J. W., & Aumann, H. H. 1994, in Science with High Spatial Resolution Far-Infrared Data, ed. S. Terebey, & J. M. Mazzarella, 1 [Google Scholar]
- Fürst, E., Reich, W., Reich, P., & Reif, K. 1990, A&AS, 85, 691 [NASA ADS] [Google Scholar]
- Gies, D. R., & Bolton, C. T. 1986, ApJS, 61, 419 [NASA ADS] [CrossRef] [Google Scholar]
- Haslam, C. G. T. 1985, Bull. Inf. CDS, 28, 49 [NASA ADS] [Google Scholar]
- Haverkorn, M., Gaensler, B. M., McClure-Griffiths, N. M., Dickey, J. M., & Green, A. J. 2006, ApJS, 167, 230 [CrossRef] [Google Scholar]
- Higgs, L. A., & Tapping, K. F. 2000, AJ, 120, 2471 [NASA ADS] [CrossRef] [Google Scholar]
- Hog, E., Fabricius, C., Makarov, V. V., et al. 2000, VizieR Online Data Catalog, 1259 [Google Scholar]
- Hron, J. 1987, A&A, 176, 34 [NASA ADS] [Google Scholar]
- Humphreys, R. M. 1978, ApJS, 38, 309 [NASA ADS] [CrossRef] [EDP Sciences] [Google Scholar]
- Junkes, N., Fürst, E., & Reich, W. 1992, A&A, 261, 289 [NASA ADS] [Google Scholar]
- Ladouceur, Y., & Pineault, S. 2008, A&A, 490, 197 [NASA ADS] [CrossRef] [EDP Sciences] [Google Scholar]
- Landecker, T. L., Dewdney, P. E., Burgess, T. A., et al. 2000, A&AS, 145, 509 [NASA ADS] [CrossRef] [EDP Sciences] [Google Scholar]
- Langston, G., Minter, A., D’Addario, L., et al. 2000, AJ, 119, 2801 [NASA ADS] [CrossRef] [Google Scholar]
- Lockman, F. J. 1984, ApJ, 283, 90 [NASA ADS] [CrossRef] [Google Scholar]
- Lozinskaya, T. A. (ed.) 1992, Supernovae and stellar wind in the interstellar medium (New York: AIP) [Google Scholar]
- Magnani, L., & Onello, J. S. 1995, ApJ, 443, 169 [NASA ADS] [CrossRef] [Google Scholar]
- Martins, F., Schaerer, D., & Hillier, D. J. 2005, A&A, 436, 1049 [NASA ADS] [CrossRef] [EDP Sciences] [Google Scholar]
- Mavromatakis, F. 2003, A&A, 408, 237 [NASA ADS] [CrossRef] [EDP Sciences] [Google Scholar]
- McClure-Griffiths, N. M., Dickey, J. M., Gaensler, B. M., et al. 2005, ApJS, 158, 178 [NASA ADS] [CrossRef] [Google Scholar]
- Mezger, P. G., & Henderson, A. P. 1967, ApJ, 147, 471 [NASA ADS] [CrossRef] [Google Scholar]
- Moffat, A. F. J., Shara, M. M., Smith, L. F., et al. 1998, JRASC, 92, 312 [NASA ADS] [Google Scholar]
- Pineault, S., Arnal, E. M., Cappa, C., et al. 2008, MNRAS, 386, 1739 [NASA ADS] [CrossRef] [Google Scholar]
- Price, S. D., Egan, M. P., Carey, S. J., Mizuno, D. R., & Kuchar, T. A. 2001, AJ, 121, 2819 [NASA ADS] [CrossRef] [Google Scholar]
- Quireza, C., Rood, R. T., Bania, T. M., Balser, D. S., & Maciel, W. J. 2006, ApJ, 653, 1226 [NASA ADS] [CrossRef] [Google Scholar]
- Raga, A. C., Noriega-Crespo, A., Cantó, J., et al. 1997, Rev. Mex. Astron. Astrofis., 33, 73 [NASA ADS] [Google Scholar]
- Reich, P., Reich, W., & Furst, E. 1997, A&AS, 126, 413 [NASA ADS] [CrossRef] [EDP Sciences] [Google Scholar]
- Schraml, J., & Mezger, P. G. 1969, ApJ, 156, 269 [NASA ADS] [CrossRef] [Google Scholar]
- Schwartz, P. R. 1982, ApJ, 252, 589 [NASA ADS] [CrossRef] [Google Scholar]
- Stil, J. M., Taylor, A. R., Dickey, J. M., et al. 2006, AJ, 132, 1158 [NASA ADS] [CrossRef] [Google Scholar]
- Stone, R. C. 1978, AJ, 83, 393 [NASA ADS] [CrossRef] [Google Scholar]
- Taylor, A. R., Gibson, S. J., Peracaula, M., et al. 2003, AJ, 125, 3145 [NASA ADS] [CrossRef] [Google Scholar]
- Tokunaga, A. T. 2000, Infrared Astronomy (Allen’s Astrophysical Quantities), 143 [Google Scholar]
- van der Sluys, M. V., & Lamers, H. J. G. L. M. 2003, A&A, 398, 181 [NASA ADS] [CrossRef] [EDP Sciences] [Google Scholar]
- Walborn, N. R. 1972, AJ, 77, 312 [NASA ADS] [CrossRef] [Google Scholar]
- Weaver, R., McCray, R., Castor, J., Shapiro, P., & Moore, R. 1977, ApJ, 218, 377 [NASA ADS] [CrossRef] [Google Scholar]
- Wilkin, F. P. 1996, ApJ, 459, L31 [NASA ADS] [CrossRef] [Google Scholar]
- Willis, A. G. 1999, A&AS, 136, 603 [NASA ADS] [CrossRef] [EDP Sciences] [Google Scholar]
All Tables
All Figures
|
Fig. 1 Large-scale CGPS 1420 MHz continuum emission towards HD 192281 and its surroundings. The stellar position is indicated by an asterisk. The square shows the region covered by the other figures of this paper. The strong continuum source located in the lower left corner of this figure corresponds to the Galactic supernova remnant G78.2+2.1. |
| In the text | |
|
Fig. 2 Radio continuum emission towards HD 192281. The upper and lower panels show the emission at 408 and 2695 MHz, respectively. The position of HD 192281 is marked by a star symbol. The white dashed contours shown in the lower panel mark the location of those areas used to measure the continuum flux density. |
| In the text | |
|
Fig. 3 Extended IR emission towards HD 192281 at 8.3 μm (upper left panel), 12.12 μm (upper right panel), 60 μm (lower left panel), and 100 μm (lower right panel). The position of HD 192281 is depicted by a star symbol. In the upper left image, the circumference centred at the stellar location marks the extension of the small ring-like structure referred to in Sect. 3.2. |
| In the text | |
|
Fig. 4 H i brightness temperature images for selected velocity ranges. The velocity range covered by each map is given in its upper left corner and the displayed temperatures are a mean over the entire velocity width. The lowest temperature contour is − 15 K and the contour spacing is 5 K. A constant mean brightness temperature value was subtracted from each image (see text). The stellar location is indicated by a star symbol. The white dashed-line circumference drawn in the middle panel marks the position of the Hi hollow feature described in Sect. 3.3. |
| In the text | |
|
Fig. 5 H i brightness temperature images for selected velocity ranges. The velocity range covered by each map is 2.47 km s-1, and the displayed temperatures are a mean over the entire velocity map velocity width. The central velocity of each image is given in the upper left corner. The beam size is shown as a circle in the upper right corner of the entire figure. A constant mean brightness temperature value was subtracted from each image (see text). The lowest temperature contour is − 21 K and the contour spacing is 7 K. |
| In the text | |
|
Fig. 6 CO emission distribution in the velocity range from +5.9 to +0.7 km s-1 (upper panel) and from –11.1 to –16.3 km s-1 (lower panel). Contour levels correspond to 0.7, 1.2, 1.7, 2.2, 2.7, 3.7, 4.7, 5.7, and 6.7 K. The location of HD 192281 is indicated by a star symbol. The main CO concentrations are labelled A, B, C, D, and E. The angular resolution is indicated in the top right corner of the upper panel. |
| In the text | |
|
Fig. 7 Radio spectrum of the shell like feature observed in the neighborhood of HD 192281. Three σ error bars are depicted along the measured flux density. The dashed line represents the flux density for an optically thin plasma having a flux density spectral index of α = −0.11. |
| In the text | |
|
Fig. 8 H i temperature brightness emission distribution from +3.5 to –4.8 km s-1 (lower left panel) and from –5.6 to –14.7 km s-1 (lower right panel). The stellar position is marked by a star symbol. A constant mean brightness temperature value was subtracted from each image (see text). The direction of the nominal peculiar stellar proper motion is shown by a solid arrow, while ± 1σ directions are shown by dashed arrows (lower right panel). In both lower panels the outer border of the bow shock is indicated by a dashed curve. In the lower left panel the ellipse depicts the bow shock cross section at a distance of 1 pc downstream from the stellar position. The upper panel shows the 3D bow shock structure orientation as it would appear to an external observer (see text). The star is located at the (0, 0) position. |
| In the text | |
|
Fig. 9 Radial distribution of the continuum emission at 2695 MHz (red line), 60 μm (blue line), H i (green line), and CO emission (magenta line) as a function of the angular distance from ( |
| In the text | |
|
Fig. 10 MSX Band A (8.3 μm, gray scale) emission distribution convolved to a 3 arc min resolution. The solid contour indicates the location of the CO clouds labelled A and B (see Fig. 6). The star indicates the position of HD 192281, and the triangle marks the position of the YSO candidate IRAS 20097+4005. The ellipse depicts the cross section of the bow shock structure corresponding to z = 1 pc downstream the apex of the bow shock. |
| In the text | |
Current usage metrics show cumulative count of Article Views (full-text article views including HTML views, PDF and ePub downloads, according to the available data) and Abstracts Views on Vision4Press platform.
Data correspond to usage on the plateform after 2015. The current usage metrics is available 48-96 hours after online publication and is updated daily on week days.
Initial download of the metrics may take a while.