Free Access
Fig. 9
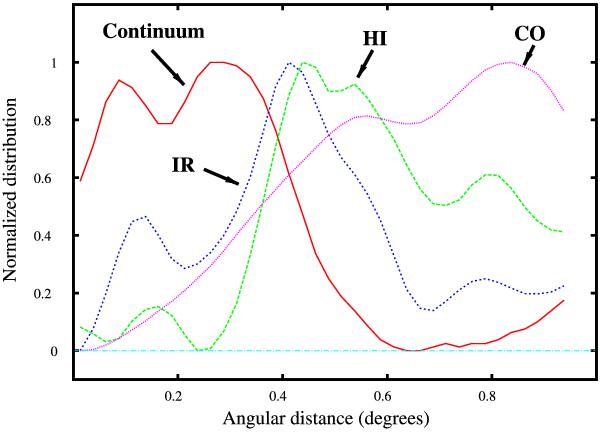
Radial distribution of the continuum emission at 2695 MHz (red line), 60 μm (blue line), H i (green line), and CO emission (magenta line) as a function of the angular distance from ( ).
).
Current usage metrics show cumulative count of Article Views (full-text article views including HTML views, PDF and ePub downloads, according to the available data) and Abstracts Views on Vision4Press platform.
Data correspond to usage on the plateform after 2015. The current usage metrics is available 48-96 hours after online publication and is updated daily on week days.
Initial download of the metrics may take a while.