Free Access
Fig. 7
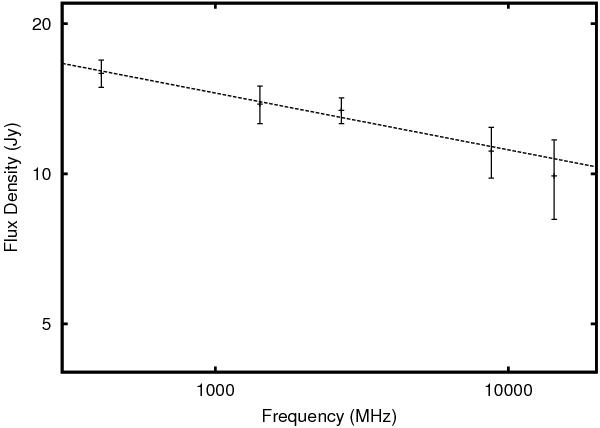
Radio spectrum of the shell like feature observed in the neighborhood of HD 192281. Three σ error bars are depicted along the measured flux density. The dashed line represents the flux density for an optically thin plasma having a flux density spectral index of α = −0.11.
Current usage metrics show cumulative count of Article Views (full-text article views including HTML views, PDF and ePub downloads, according to the available data) and Abstracts Views on Vision4Press platform.
Data correspond to usage on the plateform after 2015. The current usage metrics is available 48-96 hours after online publication and is updated daily on week days.
Initial download of the metrics may take a while.