Fig. 5
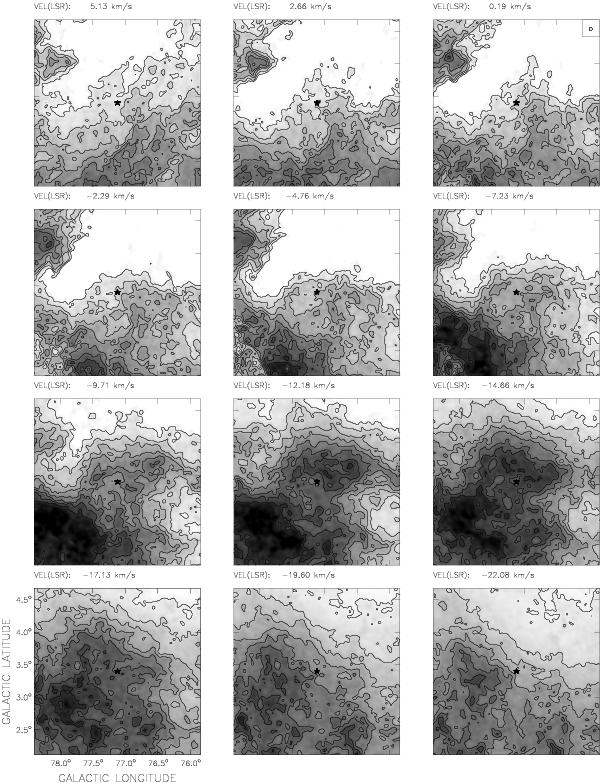
H i brightness temperature images for selected velocity ranges. The velocity range covered by each map is 2.47 km s-1, and the displayed temperatures are a mean over the entire velocity map velocity width. The central velocity of each image is given in the upper left corner. The beam size is shown as a circle in the upper right corner of the entire figure. A constant mean brightness temperature value was subtracted from each image (see text). The lowest temperature contour is − 21 K and the contour spacing is 7 K.
Current usage metrics show cumulative count of Article Views (full-text article views including HTML views, PDF and ePub downloads, according to the available data) and Abstracts Views on Vision4Press platform.
Data correspond to usage on the plateform after 2015. The current usage metrics is available 48-96 hours after online publication and is updated daily on week days.
Initial download of the metrics may take a while.